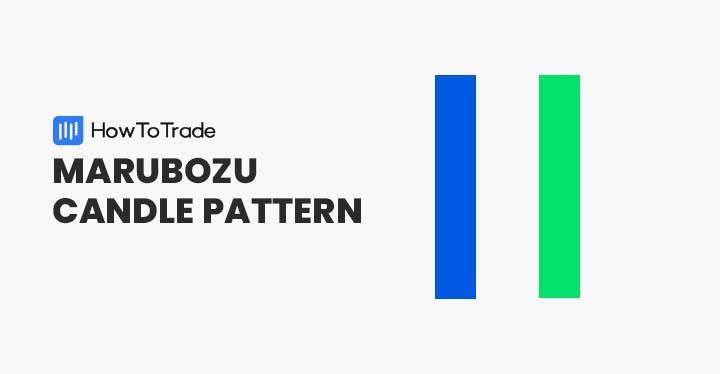
The marubozu candle pattern can be best described as a momentum candlestick pattern. For traders, it usually serves as a leading indicator that the price is expected to continue in a certain direction without any resistance.
But what does the marubozu candle pattern look like, what are the different types of marubozu candlesticks, and how do you use this unique candle pattern in trading?
Keep reading to learn more.
What is the Marubozu Candlestick Pattern?
The marubozu is part of the Japanese candlestick group a single-candle formation that has a special meaning on its own. Much like the Doji candlestick pattern and the spinning top candlestick pattern – the marubozu is a one candle pattern (although it has different variations and formations).
And much like most Japanese candlestick patterns, the Marubozu could be either bearish marubozu candle or bullish marubozu candle as long as the candle has a length of at least 2 times the average candlestick at the same trading session.
This candle pattern is characterized by a long real body with little or no upper and lower wicks and indicates that the asset is trading strongly in one direction. It, therefore, provides a great indication of the future direction of the asset and helps traders find trading opportunities.
In Japanese, the word ‘marubozu’ means shaved head or bald head, which is shown in the formation of the Marubozu candle pattern that has no shadows.
How to Identify the Marubozu Candle in Trading?
Basically, you need to have no special skills or knowledge to identify and use the marubozu candle pattern. It’s reasonably easy to identify the marubozu candle pattern as it is a single candlestick pattern with a long body and little to no upper and lower wicks.
Perhaps the most challenging part in identifying the marubozu candle pattern on candlestick charts is that the pattern may appear in any market scenario: a bullish or a bearish trend or a ranging market. As such, the marubozu could potentially be a trend reversal pattern or a continuation pattern, depending on the location at which it appears.
Still, whenever you identify a candle that is above the average in length and has no or little shadows – you should automatically associate it with the marubozu pattern.
Also, you need to follow several rules and steps when trading the marubozu candle pattern.
- Identify the marubozu candle pattern and analyze the market sentiment – bullish/bearish trend or sideways market
- Add a momentum indicator – MACD, RSI, Stochastic, or CCI
- Choose a trading strategy – enter a position immediately when the marubozu candle is completed or wait for the next candle following the marubozu candle to close above or below the closing price (depending on the direction of the candle: bullish and bearish)
- Set a stop-loss order below the lowest or highest level of the marubozu candle
Different Types of Marubozu Candles
There are three different types of marubozu candlestick patterns – A marubozu full, marubozu close, and marubozu open. Essentially, they all have the same meaning as these candle patterns tell us that either buyers or sellers are dominating the market, and that there’s strong trading momentum in a certain direction.
In this section, we’ll take a look at each type of marubozu candle pattern. For the demonstration, we used either bullish marubozu candles or bearish maribozu candles; however, the marubozu candle has the same formation for both sides.
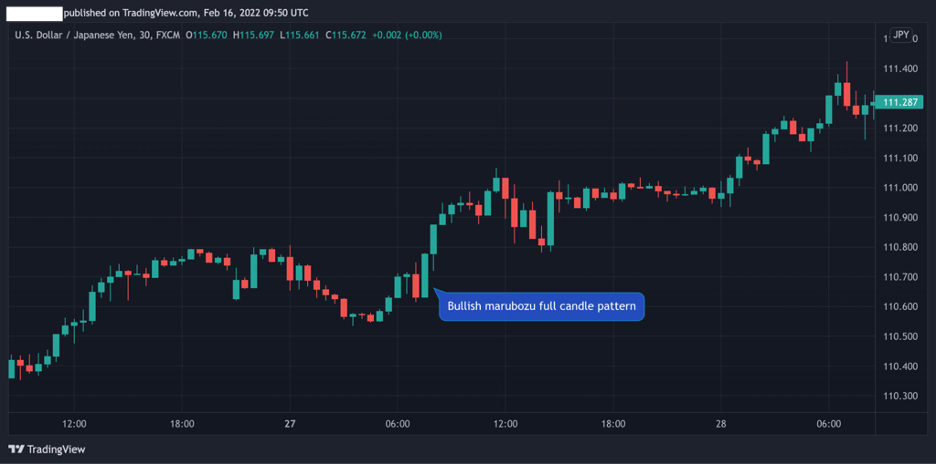
Marubozu Full Candle Pattern
The full marubozu pattern is composed of a candle with no wicks or shadows at all. This means that the highest price in the specified period equals the closing price and the lowest price equals the opening price.
Bear in mind that you’ll rarely see the full Marubozu candle pattern as it is an extremely rare candle pattern; but, when identifying this type of marubozu candle pattern, the momentum indicator is strong, and you can expect a movement in the direction of the candle.
Marubozu Open Candle Pattern
The marubozu open candle comprises a candlestick with a short wick above (or below) the closing price. Meaning the candle has a flat opening price, and it starts moving in a specific direction immediately after the opening time.

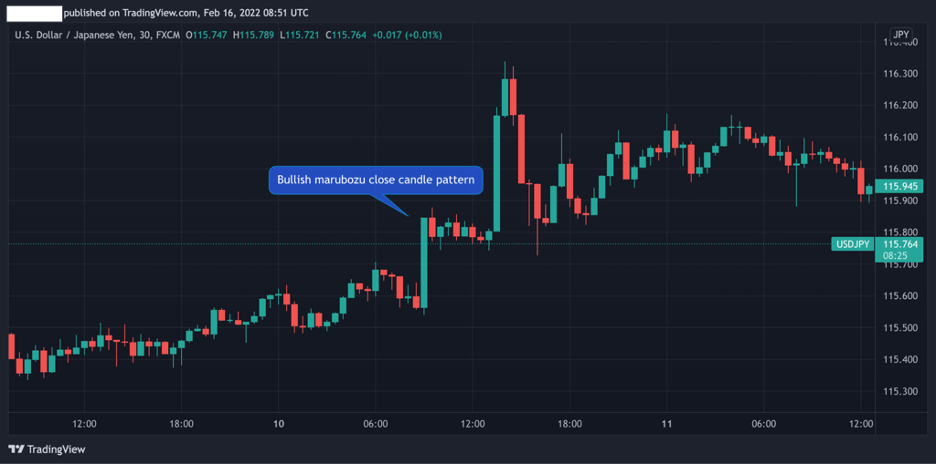
Marubozu Close Candle Pattern
The marubuzo close candle pattern is composed of a candle with no upper wick and a very short lower or upper wick. This essentially means that the price traded slightly below (or above for a bearish marubozu candlestick) the opening price, and the closing price is flat.
How to Trade the Marubozu Candlestick Pattern?
Generally, the marubozu candle signals a strong movement that is likely to continue in the direction of the candle. In other words, once identified, a trader will enter a position based on the type of candle – bullish or bearish.
Taking this into account, there are two trading strategies you need to remember when using and trading the marubozu candle pattern:
Step 1: Enter a trade immediately when identifying the marubozu candle pattern
One way to trade the marubozu candle pattern is to enter a trade immediately when the candle is completed. This way, you will not miss the first movement following the marubozu candle; however, you take a risk to get caught on a false breakout. As such, this trading method is more suited for scalping traders or those looking for short-term price movements.
The chart below shows how the candle following the marubozu candle was formed following a downward trend. The MACD helps confirm that the control is in the hands of sellers and the momentum is bearish. However, the candle following the marubozu is not bearish and has no meaning as it is a neutral candle (a Doji candlestick).
For that reason, although it’s a bit riskier than the second strategy we are going to show, this marubozu strategy works in the vast majority of cases. You are entering a trade immediately at the closing of the marubozu candle with a tight stop loss at the opening price of the marubozu.
Step 2: Wait for the next candle to close above or below the closing price
Another trading strategy to trade the marubozu candle pattern is to wait for a confirmation that appears in the price action following the appearance of the marubozu candle.
One way to do that is to wait for the candle following the marubozu to close above the closing price of the marubozu candle and only then enter a position.
Additionally, using other momentum indicators like the RSI, MACD, and Stochastic could be another confirmation indicator to determine whether the market is going in a particular direction and avoid a false breakout.
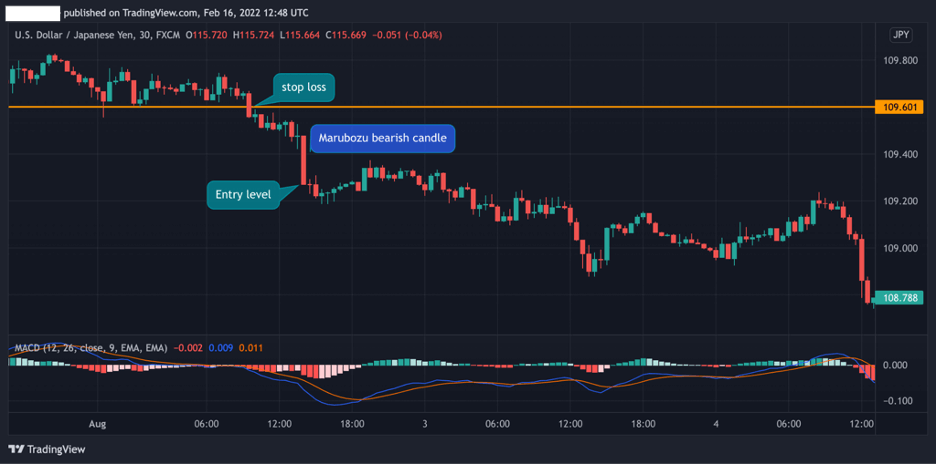
The USD/JPY 30-minute chart below shows how the second candle after the marubozu candle confirms the market trend. In this scenario, a trader will enter a position when the second candle is completed with a stop loss at the lowest price level of the marubozu (or below).

The Marubozu Candlestick Pattern – Pros and Cons
These are the most common pros and cons of trading the marubozu candlestick pattern:
Pros
- Easy to identify
- A common candlestick pattern on trading charts
- Helps in evaluating the market sentiment and trading momentum of the asset
- Effective pattern for scalping traders
Cons
- There’s a high probability you get caught on a false breakout
- Stop loss is usually placed at the opening price of the marubozu candle, meaning that there’s a high chance that the stop loss order will be triggered
Key Takeaways
Here are the key takeaways you need to consider when using the marubozu candle patterns.
- The marubozu is a single technical analysis candle pattern that indicates a strong momentum in a certain direction
- The pattern has a long body and little to no wick
- The marubozu candle is considered a trend reversal or continuation pattern, depending on its location and the market sentiment
- There are three types of marubozu candle patterns – the close marubozu, the open marubozu, and the full marubozu candlestick pattern
- When identifying the marubozu candle, traders will be looking to enter a trade in the direction of the candle with a stop loss below or above the highest or lowest marubozu candle’s opening price
Risk Disclosure: The information provided in this article is not intended to give financial advice, recommend investments, guarantee profits, or shield you from losses. Our content is only for informational purposes and to help you understand the risks and complexity of these markets by providing objective analysis. Before trading, carefully consider your experience, financial goals, and risk tolerance. Trading involves significant potential for financial loss and isn't suitable for everyone.