


Do you trade Japanese candlestick chart patterns? Is the bearish engulfing pattern part of your game plan? If
Are you searching for a chart pattern that identifies reversals? If so, the hanging man candlestick pattern may be just what you are looking for.
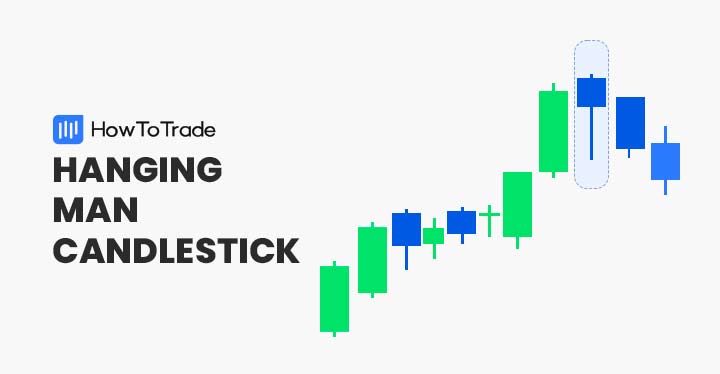
The hanging man is a Japanese candlestick pattern that signals the reversal of an uptrend. This article will cover identifying, interpreting, and trading the hanging man.
What is the Hanging Man Candlestick Pattern?
The hanging man candlestick pattern is a single-candle formation, much like other single candle patterns like the bullish harami pattern, or the Doji star pattern, for example. It forms during an upward trend and signals a potential reversal. The hanging man consists of a small body with an elongated lower wick.
How to Identify and Use the Hanging Man?
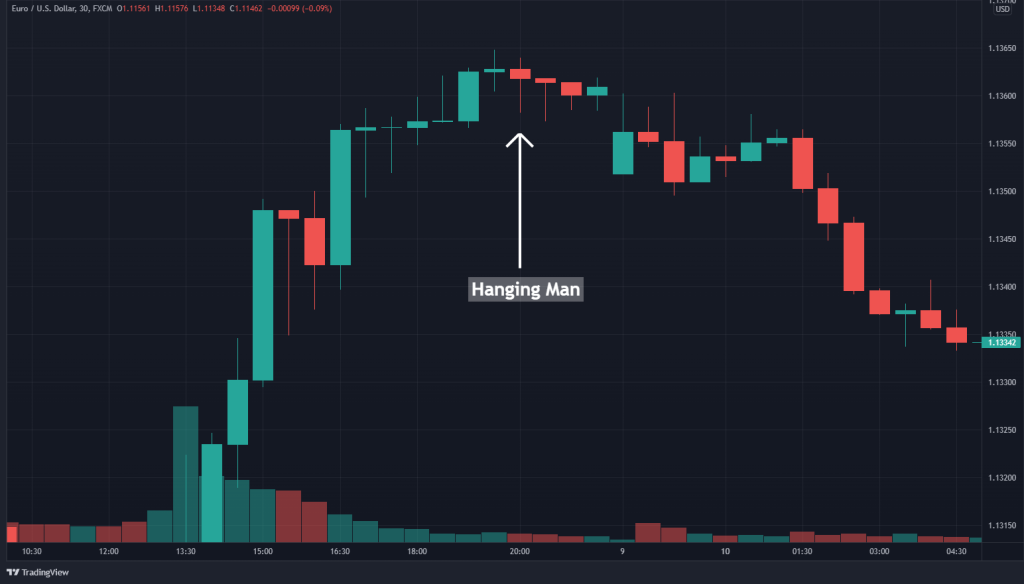
The hanging man formation signals a trend reversal. Best of all, it’s simple to identify and use. As you can see in the EUR/USD chart below, the hanging man occurs during an uptrend.
It’s important to note that all hanging man candlestick patterns are bearish reversal formations. However, there are three variations: neutral, bearish, and bullish.
Neutral Hanging Man Candlestick
It’s a point of debate whether or not a hanging man can also be a Doji pattern on candlestick charts. If a candle meets the following criteria, one may consider it to be a neutral hanging man candle:
- The candle’s opening and closing price are the same.
- The candle has a short upper shadow.
- The candle has a long lower shadow.
- The candle occurs during a bullish trend.
Bullish Hanging Man Candlestick
A bullish hanging man pattern occurs when a candle’s closing price is above its opening price. This formation is illustrated by a green or hollow candle.
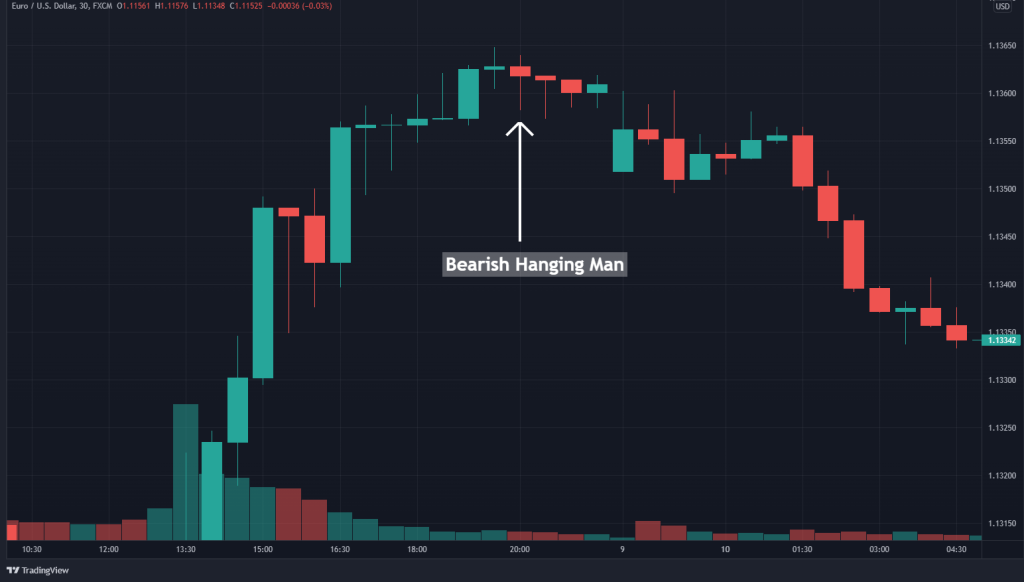
Bearish Hanging Man Candlestick
A bearish hanging man pattern occurs when a candle’s opening price is above the closing price. A red or solid candle illustrates this formation. Of the three types of the hanging man pattern, this one is the strongest reversal signal.
Hanging Man vs. Hammer Candlesticks
Visually, the hanging man and the bullish hammer or inverted hammer patterns are the same. However, there are several significant differences between the two:
- A hammer is a bullish reversal pattern. It forms within a downward trend.
- A hanging man is a bearish reversal pattern. It develops in an upward price direction.
- Hammers signal buying opportunities.
- Hanging man patterns signal selling opportunities.
Both the hanging man and hammer feature a long lower shadow and a small body. If you see a long upper shadow, it isn’t a hanging man or hammer.
How to Trade the Hanging Man Candlestick Pattern?
Trading the hanging man candlestick pattern is easy once a bullish trend is identified and a hanging man candle formation appears. All one needs to do is find a market entry point, set a stop loss, and locate a profit target.
1. Pinpoint Market Entry
As a bearish reversal pattern, the hanging man pattern forms during an upward price trend. Accordingly, the market is entered to the short as follows:
- Sell beneath the lower wick of the completed hanging man candle.
- This may be done with a stop-limit, stop-market, or market order.
- The new short position is open once a bearish candle triggers entry.
2. Set Stop Loss
Stop losses for a hanging man short are located above the candlestick pattern. This is done as follows:
- A stop-loss order is placed above the upper shadow of the hanging man candle.
- The exact location must be one or more pips above the upper shadow.
3. Locate Profit Target
A profit target may be located once the entry and stop-loss orders are active. To do so, execute the following steps:
- Select a desirable risk vs. reward ratio.
- Using the hanging man candle’s range, apply the ratio.
- Place a buy limit order as the take profit.
Example: Trading the Hanging Man as a Bearish Reversal Pattern
Perhaps the most significant advantage of trading candlestick patterns is that they are user-friendly. The hanging man is no different. Identify an upward trend, spot the hanging man pattern, and set up the trade. Check out the chart below for an example of a EUR/USD short.
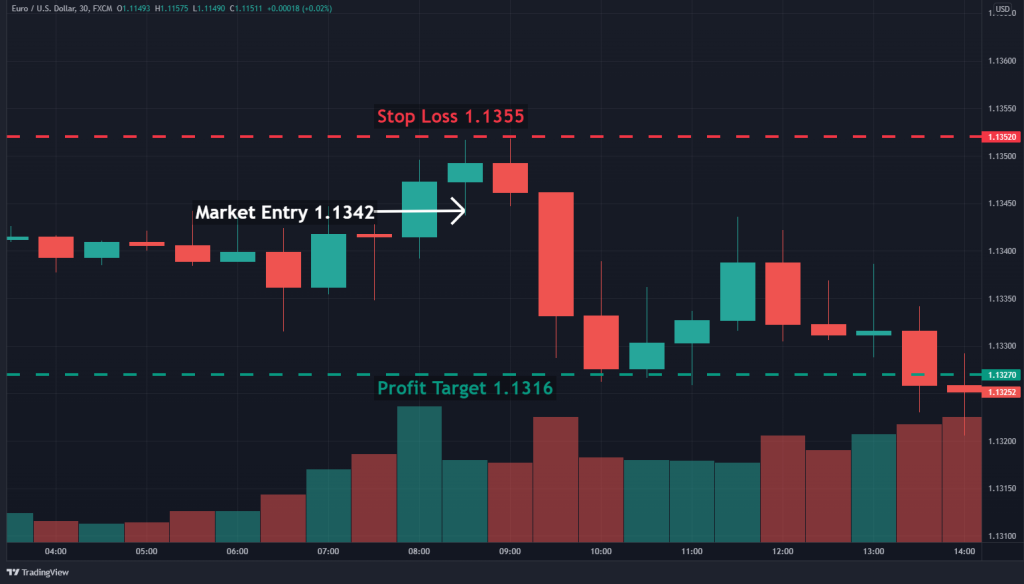
- Identify the formation in the upward trend.
- A sell order is placed at 1.1342.
- The stop-loss order is placed at 1.1355.
- Using a 1:2 risk/reward ratio, the profit target is 1.1316.
- The short position is opened upon a bearish candle confirming market entry.
The Hanging Man Chart Pattern – Pros and Cons
Every form of technical analysis has pros and cons. Here are a few of each for the hanging man pattern.
Pros
- Has a distinct appearance
- Intuitive and easy to trade
- Found on all financial market charts and time frames
Cons
- Can produce false signals
- Not as effective on shorter time frames
- Large hangman candles can be expensive to trade
Everything About the Hanging Man Candlestick in One Video
Watch this video to learn how to identify and trade the hanging man candlestick pattern with real-time examples.
Key Takeaways
Here are the key takeaways you need to consider when using the hanging man pattern.
- The hanging man pattern is a single-candle bearish reversal indicator. It occurs during uptrends in price.
- The formation comes in neutral, bullish, and bearish varieties. The bearish version is accepted as having the highest efficacy.
- To trade the pattern, place a sell order beneath the lower shadow of the candle. Stop losses are above the upper shadow, with profit targets beneath entry.
- The hanging man is not infallible. Proper risk management is recommended when trading the formation.
Risk Disclosure: The information provided in this article is not intended to give financial advice, recommend investments, guarantee profits, or shield you from losses. Our content is only for informational purposes and to help you understand the risks and complexity of these markets by providing objective analysis. Before trading, carefully consider your experience, financial goals, and risk tolerance. Trading involves significant potential for financial loss and isn't suitable for everyone.


