Japanese candlestick chart patterns are among the most popular technical tools for analyzing financial asset prices. One simple yet powerful chart pattern is the Doji star candlestick pattern.
In this article, you’ll learn how to identify, interpret, and trade Doji stars.
What is the Doji Star Candlestick Pattern?
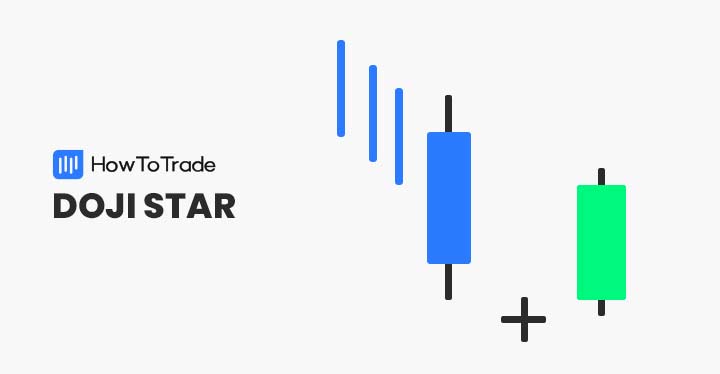
The Doji star candlestick pattern is a three-candle reversal formation (although it may be considered as a single candlestick pattern).
It consists of a large bullish or bearish candle, Doji, followed by another large bullish or bearish candle (depending on what the pattern appears). Concerning the other candles, the Doji develops after the pricing gap is up or down.
Forex traders interpret the Doji star as being a solid reversal indicator. By doing so, the pattern may be used to open a new long or short position in an FX pair.
How to Identify and Use Doji Star Candlestick Patterns in Forex Trading?
Doji stars are a triple-candle formation that suggest the current price trend may be preparing for reversal. A variation of the standard Doji candle, this formation comes in two types: bearish and bullish. The pattern is characterized by a Doji candle that has the same (or nearly the same) opening and closing price.
The EUR/USD chart below gives us a good look at what the Doji star candlestick pattern looks like on a price chart.
Adhere to the process below to use this pattern:
- Identify a bullish or bearish trend
- Locate a long bullish or bearish candle
- Spot the Doji candle (short shadows, petite body, with a similar opening and closing price)
- Wait for the third candle to be completed
- Determine either a long or short-market entry
Now, let’s take a look at the different types of the Doji star pattern.
Bullish Doji Star Pattern
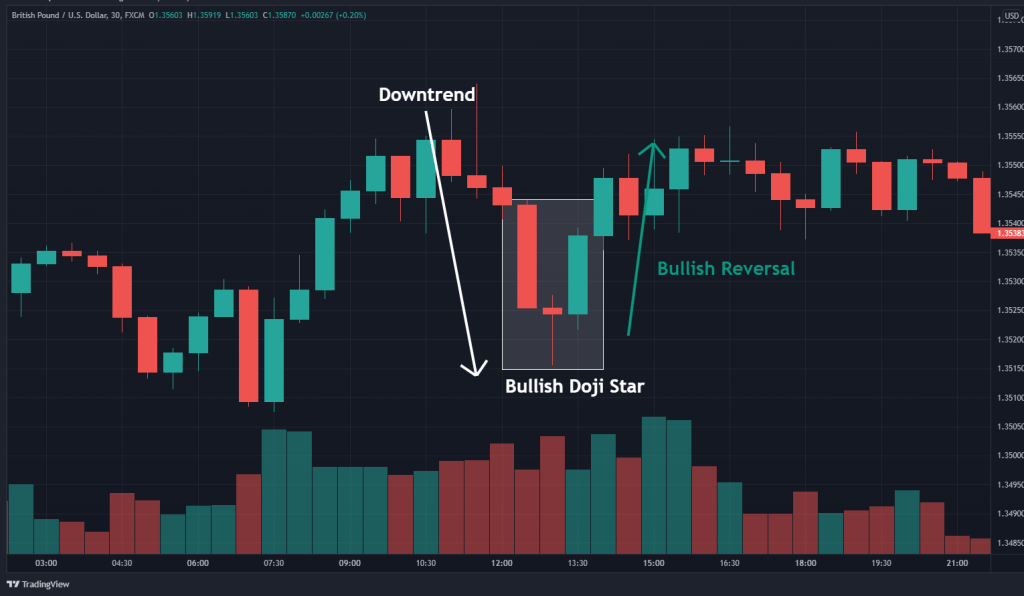
The bullish Doji star pattern signals that a prevailing downtrend may be ready to reverse course. It consists of three unique candles:
- The first candle is bearish. It appears as an elongated or normal red candlestick.
- The Doji is the second candlestick. It appears as a “+” with approximately the same opening and closing prices.
- The third candle is a large green or tall white candle.
Bullish Doji star patterns illustrate strong selling followed by indecision and recovery. It is pictured below.
Bearish Doji Star Pattern
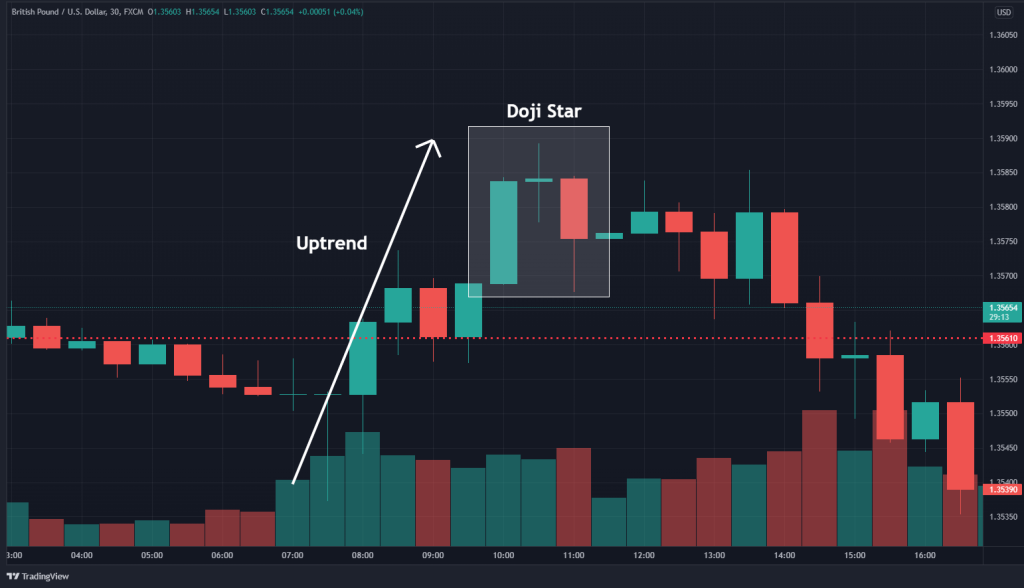
The bearish Doji star pattern suggests that a defined uptrend may be positioned for reversal. It is a bearish reversal pattern that signals a pending downward breakout in price. The three candles of the bearish Doji star are as follows:
- The first candle is a long, green, or tall white candle.
- The second candle is the Doji.
- The third candle is a long, red, or solid candle.
The bearish Doji star candlestick formation indicates that an uptick in price action may be in the offing. It is pictured below.

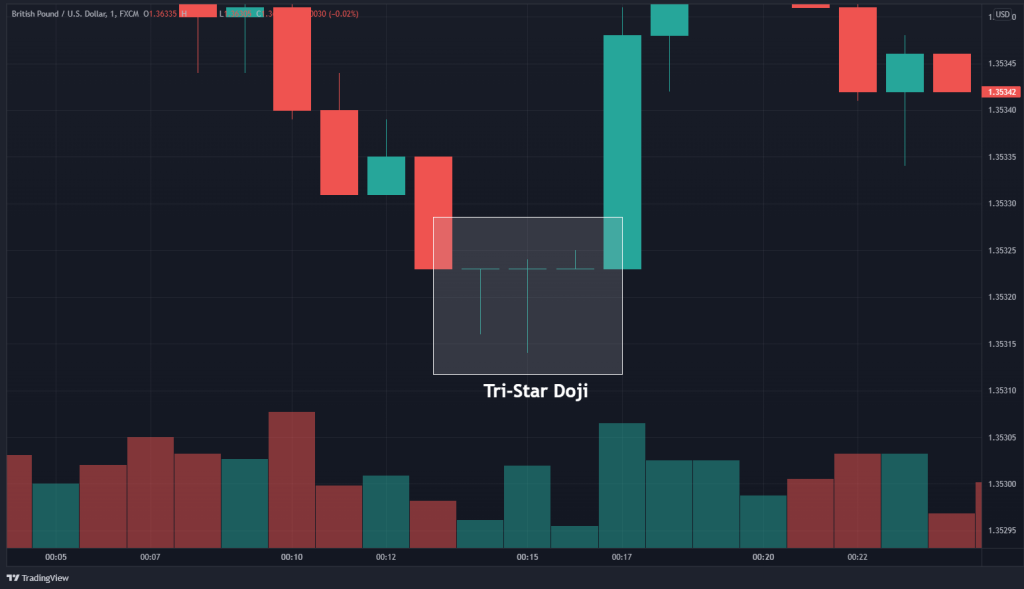
The Doji Tri-Star
An exceptionally unique pattern on Japanese candlestick charts is the Doji Tri-Star. This formation consists of three consecutive Dojis. It occurs during an uptrend or downtrend and may signal a bearish or bullish reversal.
Below is an illustration of the Doji candlestick Tri-Star pattern.
How to Trade the Doji Star Pattern?
As with any candlestick pattern, there’s a specific way to trade Doji stars. And, it’s consistent regardless of whether you’re studying currency, commodity, or stock price. Simply identify the market entry, locate stop losses, and set profit targets.
1. Determining Market Entry
The Doji star is a reversal indicator. So, it may be interpreted as either a buy or sell signal:
- In uptrends, the Doji star is a bearish reversal indicator and identifies a shorting opportunity. To do so, a sell order is placed below the third candle’s low.
- In downtrends, the Doji star is a bullish reversal indicator and identifies an opportunity to go long. To do so, a buy order is placed above the third candle’s high.
2. Locating Stop Losses
When trading the Doji star, stop losses may be used to close out a long or short position in the case the position goes against you:
- For a bullish Doji star pattern, the stop loss is placed below the Doji (second candle).
- For a bearish Doji star pattern, the stop loss is placed above the Doji (second candle).
3. Setting profit targets
Due to Doji stars being reversal indicators, the potential for significant profits does exist. Typically, forex risk vs. reward ratios of 1:2 or better are applied. Here’s where profit targets are located for long and short positions:
- For a bullish Doji star, the profit target is placed above the third candle of the pattern.
- For a bearish Doji star, the profit target is placed below the third candle of the pattern.
Let’s see a trading example of the Doji star pattern:
Using the Doji star to trade price trend reversals can be a profitable trading strategy. The GBP/USD example below illustrates the trading functionality of this indicator.
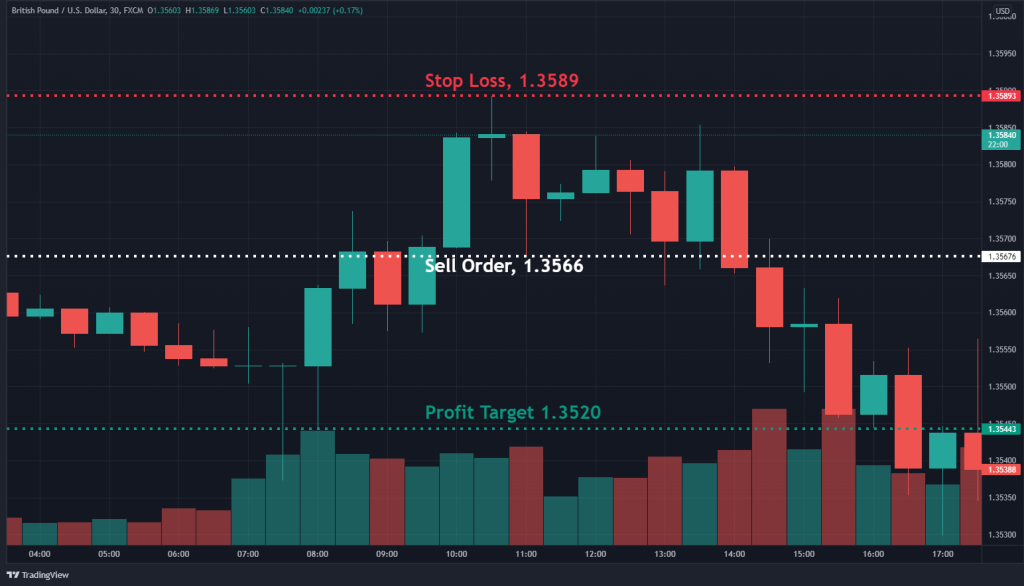
The aforementioned GBP/USD trade was executed as follows:
- A pronounced uptrend was identified.
- The bearish Doji star is set up on the 30-minute chart.
- A sell order was placed at 1.3566, beneath the third candle of the pattern.
- A stop loss was placed at 1.3589, above the Doji.
- A profit target was placed at 1.3520, beneath the pattern according to a 1:2 risk vs. reward ratio.
- Upon the trade going live, the profit target was reached for a gain of 46 pips.
The Doji Star – Pros and Cons
All chart patterns have a collection of pros and cons. Below are a few of the most important for the Doji star.
Pros
- Readily identifiable
- Occurs on all forex pairs on all time frames
- Can generate significant profits by projecting market reversals
Cons
- The pattern may produce false signals
- Requires significant capital to trade on longer-term charts
- Has a reduced efficacy on shorter time frames
Key Takeaways
In conclusion, here are the key takeaways:
- The Doji star is a reversal indicator found in uptrends and downtrends. It comes in two types: the bullish and bearish Doji star.
- The pattern consists of three sequential candles.
- The first candle is a long bearish or bullish candle; the second is the Doji; the third is a long bearish or bullish candle.The pattern may be used to open new long or short positions in any FX pair.
Frequently Asked Questions (FAQs)
The following are three frequently asked questions regarding the Doji star candlestick pattern.
Is the Doji star a reliable reversal indicator?
Yes. However, it’s essential to understand that no chart pattern is 100% accurate. When trading Doji stars, be sure to implement sound risk management principles.
What is the difference between doji and doji star?
The main difference between the Doji candlestick pattern and the Doji star pattern is that the first is a one-candlestick pattern that may appear in any market scenario and signal indecision. On the other hand, the Doji star pattern is a three-candle pattern, with a middle Doji candle, that indicates the possibility of a price reversal.
Can I use the Doji star on commodities, shares, and crypto?
Yes. Doji stars may be found on any tradable product in any time frame.
Risk Disclosure: The information provided in this article is not intended to give financial advice, recommend investments, guarantee profits, or shield you from losses. Our content is only for informational purposes and to help you understand the risks and complexity of these markets by providing objective analysis. Before trading, carefully consider your experience, financial goals, and risk tolerance. Trading involves significant potential for financial loss and isn't suitable for everyone.