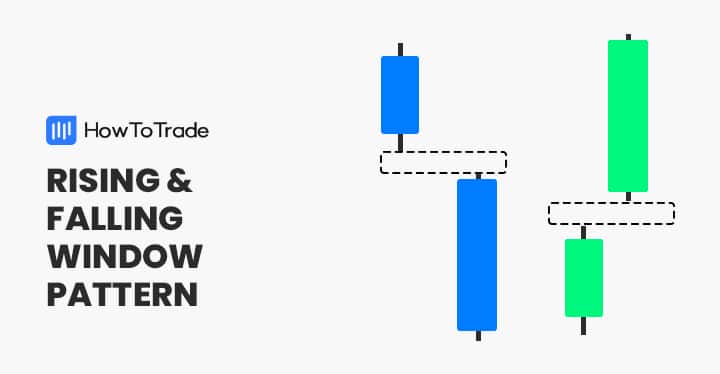
The rising and falling windows are chart patterns that consist of two candles in the same direction with a gap between them. As a gap in trading is a strong sign of high volatility and new developments in the market, these patterns are considered reliable and accurate in predicting the next price movement.
- The Rising and Falling Window Patterns illuminate pivotal shifts in market sentiment.
- By accurately identifying these patterns, traders can gain an edge in predicting price continuations or reversals.
- Mastery of these patterns enables traders to seize timely entry and exit points, optimizing profit potential.
This guide will provide everything you need to know about the rising and falling window patterns and how to trade them.
What is the Rising and Falling Window Candlestick Pattern?
The rising and falling window are two candle continuation chart patterns with a gap between the two candles. For those unaware, a gap in trading is an empty area on a trading chart with no trading activity.
It typically occurs when the previous candle’s closing price and the next candle’s opening price have a significant price difference. Now, as most gaps in trading tend to get filled over time, both the rising and falling patterns suggest that the existing price trend is likely to continue following the gap.
So, the rising window pattern is a two-candlestick bullish continuation pattern with a gap between the two bullish candles that usually appears in an uptrend. Conversely, the falling window appears typically in a downward price trend and is a two-candlestick bearish pattern with a gap between them.
Both patterns usually appear during a trending market; however, in some cases, they may also appear in different market scenarios (as you can see in some of our trading examples below).
Technically, the gap is the most important part of the window chart patterns. It tells us that there is a high volume in the market.
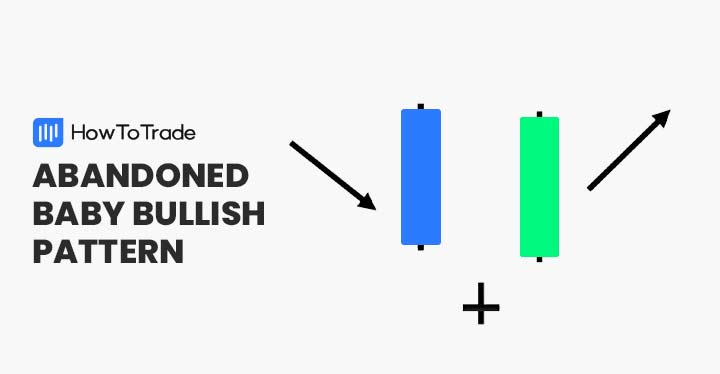
In a rising window candlestick pattern, the gap occurs due to heavy buying pressure, whereas in a falling window, the gap occurs due to high selling pressure. That is one of the reasons why many chart patterns with a gap are known as very accurate. Some of these include the upside & downside gap three methods patterns, the island reversal pattern, and the abandoned baby bullish pattern.
One thing to keep in mind is that gaps usually tend to be filled after some time; however, in the case of the rising and falling window chart patterns, you should not necessarily wait for the gap to get filled.
Upon identifying the window patterns, many traders immediately enter a position, anticipating that the trend will continue and the gap will be filled later.
How to Identify the Rising and Falling Window Candlestick Pattern in Trading?
As a two-candle pattern, the rising and falling window patterns have a simple and easy-to-recognize structure. Below, we’ll see how you can identify the rising and falling window patterns.
Identify the Rising Window Chart Pattern
Identifying the rising window pattern is simple. Once you have found two consecutive bullish candles with a gap between them during a bullish trend, you can assume it is the rising window pattern.
But first, let’s see the rising window pattern on a price chart.

As seen in the chart above, the price action above has two bullish candles with a gap between them. The pattern indicates high buying pressure and trading volume. Usually, it could be due to developments in the market or any other fundamental factors that impact the price action.
Now, as mentioned earlier, rising window candlestick patterns usually appear during an uptrend; however, the pattern could also occur after a downward trend or during a ranging trading mode.
In the example above, the rising window candle pattern actually appears following a bearish trend, indicating a trend reversal. And, as seen in the chart, once the pattern is formed, the price immediately starts moving upwards.
With the above in mind, here are some crucial points to remember when identifying the rising window pattern.
- Typically, look for the rising window pattern in an uptrend, although it may also appear at the end of a downward trend or in a ranging market.
- The second candle should be above the first, with a gap between the two candles.
- The price does not have to fill the gap. If it does, you must wait for the price to rise above the highest level of the second candlestick.
Identify the Falling Window Chart Pattern
As for the falling window, the process is the same but on the opposite side. To identify the falling window chart pattern, you must find two bearish candlesticks with a gap between the first and second candles.
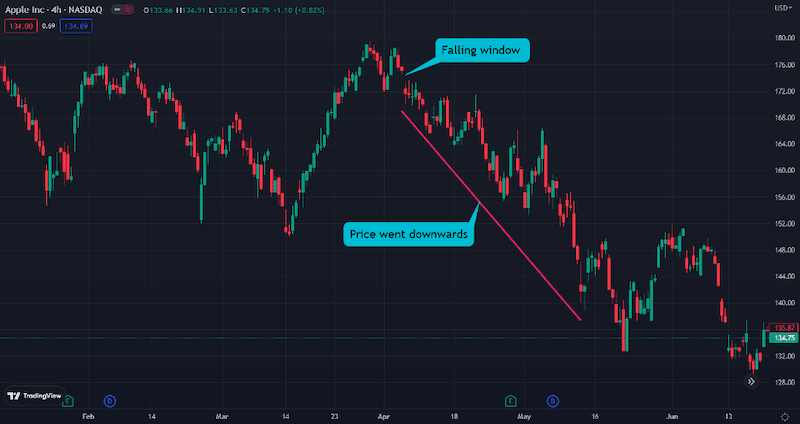
In the chart below, you can see a perfect falling window pattern – two bearish candles with a gap between them. Upon the completion of the second bearish candle, the price is likely to fall, and a sell signal is made.
Some key points to remember to identify and trade the falling window pattern successfully are:
- Look for the falling window pattern in a downtrend.
- The second candle should be below the first, with a downward gap between the first and second candle.
- The price does not have to fill the gap. If it does happen, you must wait for the price to fall below the lowest level of the second candlestick.
The Rising and Falling Window Candlestick Pattern Trading Strategy
As mentioned, the rising and falling windows are mostly continuation patterns that provide an excellent entry-level to join a trend. As such, whenever you identify the window chart patterns, you instantly get a signal to enter (or exit ) a trade in the direction of the trend.
However, like many other chart patterns, the rising and falling windows may produce false signals, so you must confirm the signal with another technical indicator.
You can use many indicators and tools when trading with the rising and falling window patterns, including momentum indicators such as RSI, MACD, and Stochastic Oscillators. However, here, we’ll discuss how you can trade window patterns with our favorite indicator – Fibonacci levels.
Rising Window Candle Pattern with Fibonacci Levels
To trade the rising window pattern with Fibonacci, first, we need to draw the Fib levels on a price chart. While many beginner traders need clarification when drawing Fibonacci levels, it’s easier than you might think.
Simply put, you must draw the levels from the swing low to the swing high in an uptrend and vice versa for a downtrend. To do so, it’s helpful to switch to a longer time frame and then switch back to a shorter time frame. Nonetheless, if you are unsure how to do that, you can visit our guide on using the Fibonacci retracement tool.
So, once you have identified the rising window chart pattern and added Fibonacci retracement levels to your chart, you can easily find well-defined entry and exit levels, as you can use every significant Fib level as a support and resistance level.
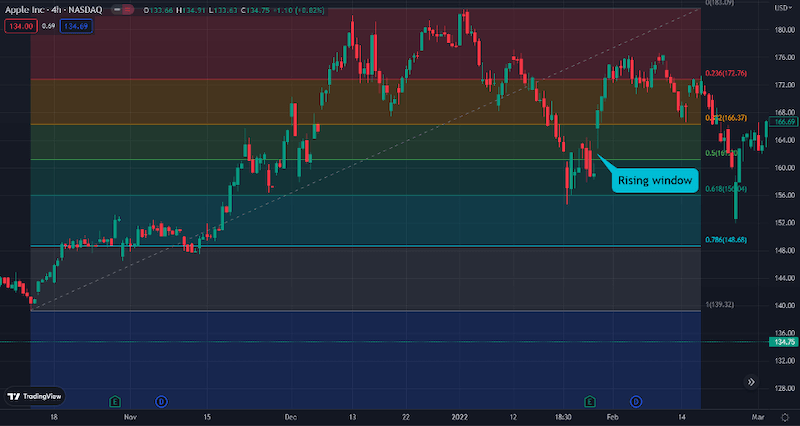
The chart above shows how a rising window pattern is formed at the 50% Fib level. After the pattern is formed, you must wait for the second candle to close and then take a buying position. In the example above, you would enter a position slightly above the %38.2 Fib level and use it as a support level for your stop loss order. Then, take profit is placed at the 23.6 Fib level.
Falling Window Candle Pattern with Fibonacci Levels
As for trading falling window patterns, you must draw the Fib levels from the swing high to the swing low. Once you have identified the falling window pattern, you can use any Fib level as a support and resistance level.
The chart below shows the falling window pattern with two bearish candlesticks and a price gap between them. Once again, the Fibonacci levels help you find entry and exit levels and know where to set your stop loss and take profit orders.
In the case of a falling window pattern, you can set your stop-loss order at the recent swing high or exit the trade when the gap between the two candles fills and the price continues to trade higher. For TP, you can place it at the next Fib level.
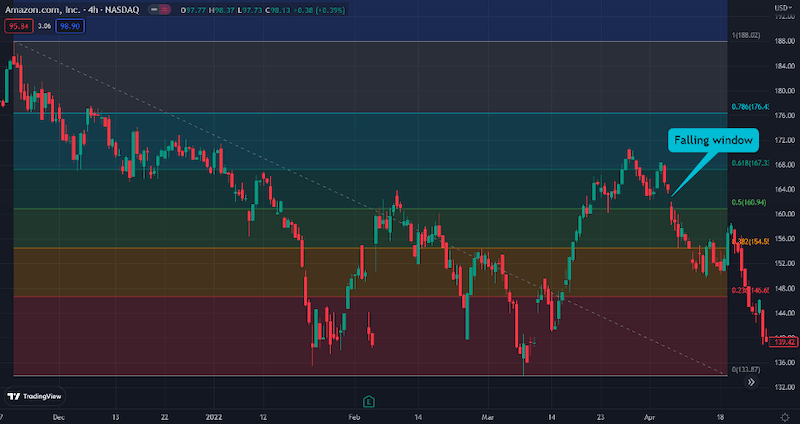
In this case, we can use either the 50% Fibonacci level or the 38.2% level to enter a short-selling position. Stop loss could be placed at the 61.8% Fib level, and the take profit target could be set at the 23.8% level or the lowest level of the previous price swing, hence the 0% Fib level.
The Rising and Falling Window Chart Pattern – Pros and Cons
Like all other classical chart patterns, the rising and falling window patterns have pros and cons.
Pros
- The window patterns have a simple structure, and identifying them in price charts is relatively easy
- The rising and falling patterns work on all timeframes
- With the combination of Fibonacci levels, the rising and falling patterns give you a clear stop loss and take profit target
Cons
- The patterns only appear occasionally on intraday time frames
- Due to the forex market operating 24 hours a day, the pattern is less visible on the forex charts than on other markets
Key Takeaways
Below you can find the key takeaways of trading the rising and falling window chart patterns.
- The falling and the rising window are continuation chart patterns that provide a trading signal to join an existing trend
- In terms of structure, the patterns are made of two candles, each having a bullish/bearish structure with a gap between them
- The gap between the candles indicates a high buying or selling pressure
- Upon identifying the rising and falling window patterns, you should add technical analysis indicators to find entry and exit levels. The Fib levels work well with the window patterns, providing key support and resistance levels
Frequently Asked Questions (FAQs)
Check the most frequently asked questions about the falling and rising window chart patterns:
What is a price gap?
A price gap occurs when there is no trading activity in a certain area on a price chart. For example, there is a gap when the market closes at a specific price and opens much higher.
What are the best indicators to identify rising and falling window price patterns?
There are many indicators to combine with the window patterns; however, momentum indicators might be ideal for determining the strength of the existing trend. For example, you can apply many momentum technical analysis indicators like the RSI, MACD, and Stochastics. Moreover, we suggest integrating Fibonacci retracement levels with window patterns to find entry and exit levels.
Can you trade the rising and falling window chart pattern in intraday time frames?
Yes, you can. Although gaps typically occur in a daily time frame between one day to the next, you can undoubtedly find trading gaps in intraday time frames. Additionally, we highly recommend learning and using the order flow trading strategy when trading with chart patterns.
Risk Disclosure: The information provided in this article is not intended to give financial advice, recommend investments, guarantee profits, or shield you from losses. Our content is only for informational purposes and to help you understand the risks and complexity of these markets by providing objective analysis. Before trading, carefully consider your experience, financial goals, and risk tolerance. Trading involves significant potential for financial loss and isn't suitable for everyone.