Understanding the supply and demand concept is key to being successful in forex trading. It is the driving force behind forex currency pairs’ price fluctuations and any tradable asset in general. As a matter of fact, many professional traders who specialize in the naked price action trading strategy focus primarily on supply and demand trading. And there’s a good reason for that.
But what are these levels, and how can you use them to make trading decisions?
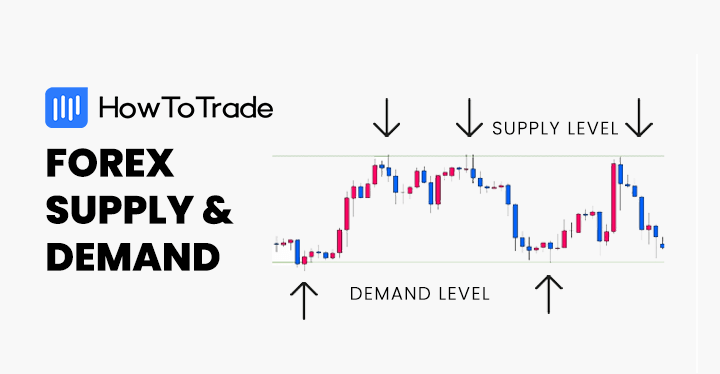
- Forex supply and demand zones are areas on a chart where the price movement of a currency pair is likely to experience a change in direction due to an imbalance between buyers and sellers.
- Various tools to identify supply and demand zones include Fibonacci retracament levels, order blocks, and volume indicators.
- Trading supply and demand is a simply yet effective trading technique that can assist traders in findingn trading opportunities.
In this guide, you’ll learn how to spot supply and demand zones like a pro and use them to your advantage in your trading strategy. So, make sure to stick to the end!
- What are Forex Supply and Demand Zones?
- How to Identify Supply and Demand Zones in Trading?
- Mastering the Forex Supply and Demand Strategy – Tips and Tools
- How to Trade Forex Using the Supply and Demand Strategy
- The Supply and Demand Trading Strategy PDF
- Supply and Demand in Forex Trading – Key Takeaways
- Frequently Asked Questions (FAQs)
What are Forex Supply and Demand Zones?
Forex supply and demand zones refer to areas on a chart where the price movement of a currency pair is likely to experience a change in direction due to an imbalance between buyers and sellers. These zones pop up on the chart when there is a significant increase in buying or selling pressure. When the price of a financial asset approaches these levels again, traders often look for trading opportunities based on the expectation that the price will either reverse or continue in the same direction.
But first, let’s get back to the basics and define supply and demand in forex trading. According to the principle of supply and demand, the price will rise when there is a high demand for a currency pair, hence, more buyers than sellers. Conversely, when there is a high supply of one currency pair versus the other, and there are more sellers than buyers, the price will fall. That is one of the most basic trading theories that every trading coaching program will teach you.
But there is more than that. The price of any tradable asset must also find an equilibrium at some point. This is what creates supply and demand zones. Even in a trending market, prices pause for a while as they find a balance between buyers and sellers. That is the concept of supply and demand zones in forex trading. And price action traders use this method to find zones where they can enter trades based on the economic theory of supply and demand.
Now, in forex trading, factors such as economic policy, political events, and market sentiment may significantly impact the demand or supply of a currency. For instance, should the Federal Reserve raise rates in the US, it is more than likely that the demand for the US dollar will increase against other currencies as investors will invest their money in US bonds, fixed-income assets, and other deposits that allow them to receive a high annual income.
However, foreign investment will be on hold if a country is in political turmoil or a military conflict. That could create a weakness of its local currency versus a specific foreign currency (let’s say the US dollar) as there is a low supply of foreign currencies in the market. In this case, the rate will rise in favor of the US dollar.
Why are Supply and Demand Important for Trading?
So, why are these supply and demand levels so crucial in forex trading?
In economics and finance, demand is defined as a scenario when more people wish to purchase a specific good. Now, if the supply is limited, the price of a good will increase. But, on the other hand, when there is too much supply of a particular good, and not many people are keen to purchase it, the price of a good will decline. The same principle applies to the forex market.
As a result, supply and demand forex trading is a method by which traders analyze the economic forces behind FX currency rates. They know ahead at what zones the price may retrace or pause. Supply and demand traders also know what FX levels of a particular pair might cause problems for a local economy.
Remember that in the foreign exchange market, FX currency rates greatly impact a country’s global economy, exporters, and importers. Sometimes, you might notice that a local central bank may intervene to keep the rate at a certain level. This, for example, can be a result of pressure from importers, exporters, or large tech companies.
Additionally, you can notice the involvement of big players such as institutional investors, hedge funds, and governments. When these big players enter the market, they bring in a significant amount of buying or selling power that can shift the balance of supply and demand. Once you learn how to interpret the forex market efficiently, you will be able to notice when these institutions enter the market and place large order blocks to buy or sell a particular FX currency.
And that is why demand and supply zones are crucial to understanding why prices move in a certain direction. If you master this method, you’ll know precisely what zones are crucial for a particular currency and where you might buy or sell to make a profit.
Teach a parrot the terms ‘supply and demand’ and you’ve got an economist.
Thomas Carlyle
How to Identify Supply and Demand Zones in Trading?
Identifying supply and demand revolves around the same technique as identifying support and resistance levels. Still, there are some minor differences between the two.
First, here are some steps you need to follow to identify these zones like a pro:
- Start by identifying significant price levels on the chart, such as highs and lows.
- Look for areas on the chart where the price has been consolidating or ranging for an extended period. These zones often indicate a balance between supply and demand.
- Price spikes can indicate a sudden increase in buying or selling pressure, creating a zone of supply or demand.
- Use Fibonacci support and resistance level, pivot points, and technical analysis indicators. These tools can help you identify areas or zones where the price might bounce back and create supply or demand zones.
- Read market news and announcements from central bankers about any specific FX levels a local central bank may protect.
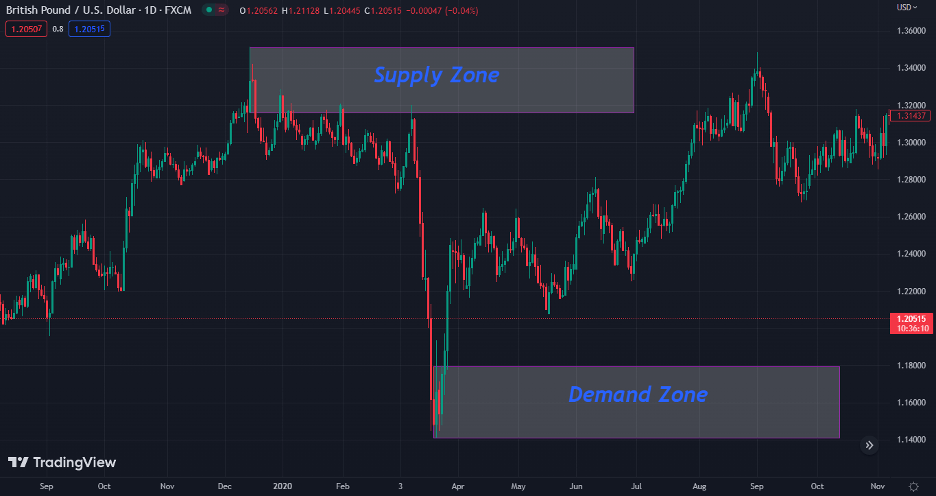
Let’s see an example of what forex supply and demand look like on a price chart:
Demand Zone
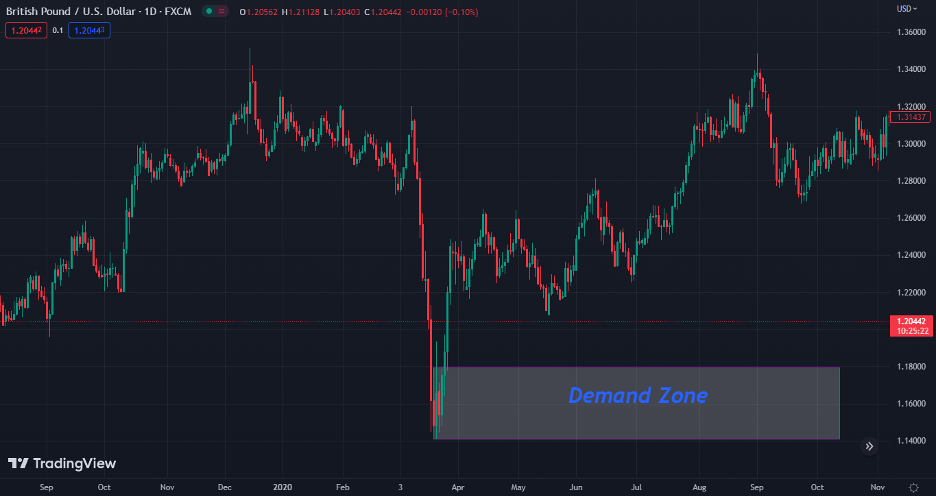
A demand zone is an area on a price chart with a significant level of buying power, resulting in a price increase or a reversal of a downtrend. You can identify the demand zone by looking at areas on the chart where the price has bounced back several times, indicating buyers are willing to enter the market at that level.
Typically, forex market participants will enter the market at this price level or exit short-sell positions as they know it is a crucial price level that is not likely to get easily broken.
Here is what a demand zone looks like on a price chart.
Supply Zone
A supply zone is an area on a price chart with significant selling power, resulting in a price decrease or a reversal of an uptrend. You can identify supply zones by looking at a level where the price has struggled to break through several times, indicating intense selling pressure.
Similarly to a demand zone, a supply zone represents an area where market participants expect to serve as a resistance level.
Here is what a supply zone looks like on a price chart.

Mastering the Forex Supply and Demand Strategy – Tips and Tools
In this section, we suggest tips and tools help you master the supply and demand trading strategy.
1. Use Fibonacci Retracement Levels
To use Fibonacci levels with supply and demand zones, you can look for areas where the Fibonacci retracement levels align with the supply or demand zones.
For example, if a demand zone lines up with the 50% Fibonacci retracement level, it suggests a strong likelihood that the price will bounce from that level. If the price breaks below that level, a strong signal is given to enter a short-selling position.
To learn more, you can visit our blog post on how to use the Fibonacci retracament tool.
2. Add a Volume Indicator and Identify Supply and Demand Zones with High Trading Volume
While identifying supply and demand zones on a price chart is essential for forex trading, you can add a volume indicator to determine these zones’ strengths. By analyzing the trading volume at specific price levels, you can identify high buying or selling pressure areas.
Let’s say you have identified a potential supply zone for GBP/USD at a specific price level. Adding a volume indicator like the Volume Weighted Average Price (VWAP) to the chart lets you see if selling pressure exists. A high volume of sell orders at that price level indicates intense selling pressure and that the supply zone is valid.
3. Work with Chart Patterns
Chart patterns are a powerful tool for technical analysis in forex trading. Combining chart patterns with supply and demand zones gives you a more comprehensive view of market trends and potential price movements.
For instance, popular chart patterns you can use with supply and demand zones include the double top pattern and double bottom pattern or triple bottom and triple top patterns.
Other patterns, such as the Adam and Eve pattern, the Wyckoff chart pattern, and many harmonic chart patterns can also help you identify supply and demand zones. These patterns typically occur when the price reaches a high/low point twice before reversing direction, creating a resistance/support level.
You can combine these patterns with a supply/demand zone to confirm a potential trend reversal.
4. Switch to Longer Time Frames
Upon identifying supply and demand zones in forex trading, many traders make the mistake of focusing solely on shorter timeframes.
Looking at the supply and demand zones on longer timeframes may give you a clear picture of the overall trend. Therefore, using multiple timeframe analysis, you must combine longer and shorter timeframes for a more comprehensive market view.
Moreover, you should take a look at the all-time price chart, as well as the daily/weekly/monthly chart of a currency pair to identify supply and demand zones. This can help you identify supply and demand zones that may not be visible on shorter timeframes.
5. Use Technical Indicators for Another Confirmation of Supply and Demand Zones
You can also combine technical indicators to confirm supply and demand zones. This is super helpful when the market is moving sideways.
For example, you might use a technical indicator like the Relative Strength Index (RSI) to confirm a potential supply or demand zone reversal. If the RSI indicates that the market is overbought or oversold, it could be a sign that the price is likely to reverse soon. If this aligns with a supply or demand zone, it could provide another solid signal to enter or exit a trade.
Watch this video to learn more about the supply and demand trading strategy:
How to Trade Forex Using the Supply and Demand Strategy
The supply and demand principle drives the value of currencies and, by extension, determines the profitability of your trades. These supply and demand zones can be used in many market scenarios; however, this section will show you two effective yet simple trading strategies to help you use these zones as a practical tool to find profitable trades – range and breakout trading.
Supply and Demand Zones – Trading a Ranging Market
Supply and demand zones can be helpful in trading a ranging market, as they represent levels where prices are likely to change direction. Once you have identified a sideways market using the range trading strategy with clear supply and demand zones, here’s how you can integrate the supply and demand strategy into your Forex trading plan:
1. Determine The Entry-Level
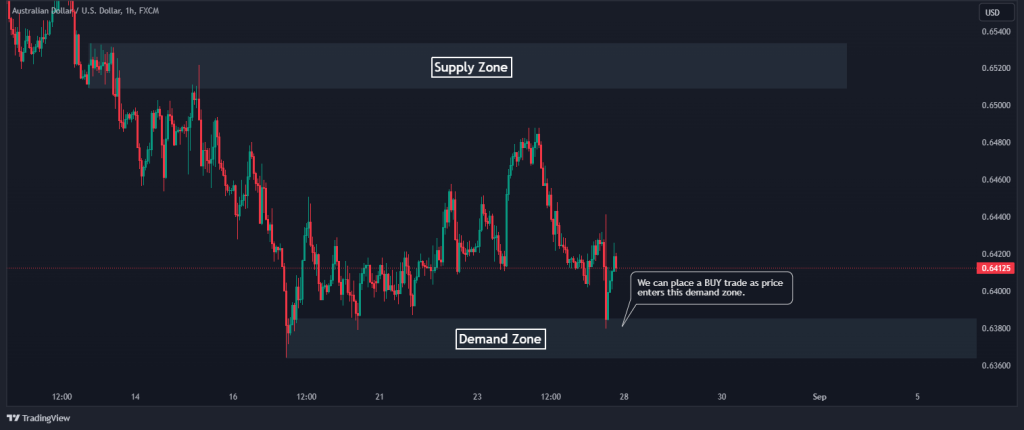
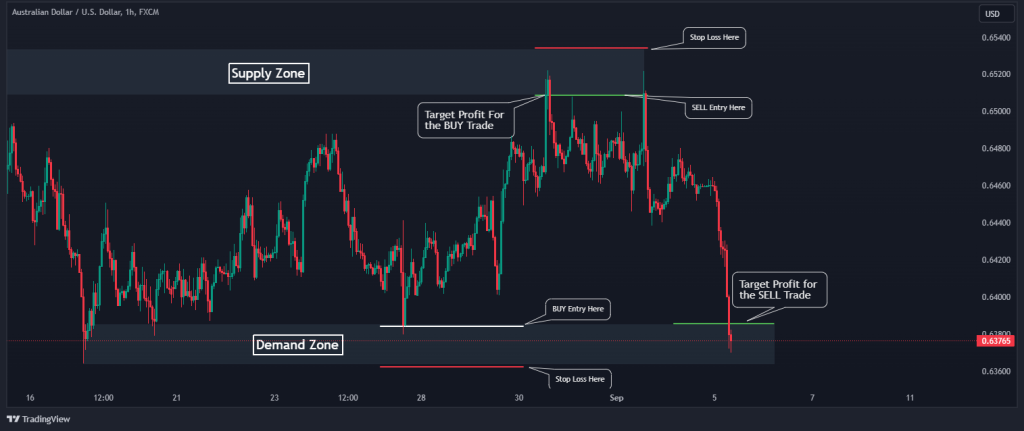
During a ranging market, price keeps bouncing from the supply zone to the demand zone, and vice versa. In these scenarios, the best practice is to enter long positions at the support (or demand) levels and short positions at the resistance (or supply) levels.
Consider the AUD/USD chart below; the price is found to range between the supply and demand zone. As the price approaches the demand zone, we can expect the market to BUY from this zone.
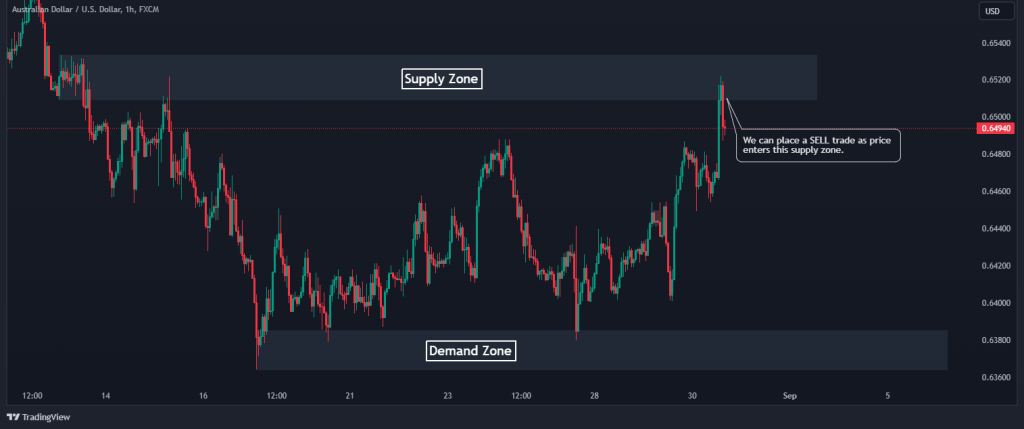
Also, consider the same chart below. After the price has entered the supply zone, we can enter a SELL position and sell all the way down to the demand zone again.
2. Set Your Stop Loss
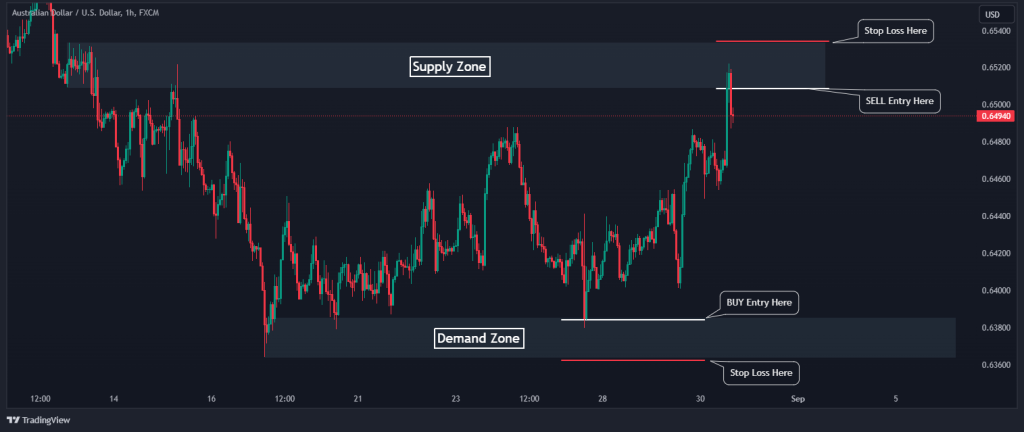
In a ranging market, stop-loss orders should be placed above the supply zone when you are in a SELL trade or below the demand zone when you are in a BUY position. In this case, the chart below shows where we would place our stops for two trades that were highlighted earlier.
3. Take Profit
In a ranging market, you should place take-profit orders on the opposite side. For example, if you buy AUD/USD at the demand zone, you could set a take-profit order just below the supply zone. This will ensure that you exit the trade with a profit when the price reaches the upper boundary of the range. For a SELL trade, you can set your target profit just above the demand zone, as shown in the chart below.
Supply and Demand Zones – Trading the Breakout
After the price has gone back and forth within a range, there’s always a breakout. Trading breakouts is also another popular strategy you can use with the supply and demand zones. Breakouts occur when the price breaks beyond the support (demand) or resistance (supply) levels. Here’s how it works:
1. Entry Level
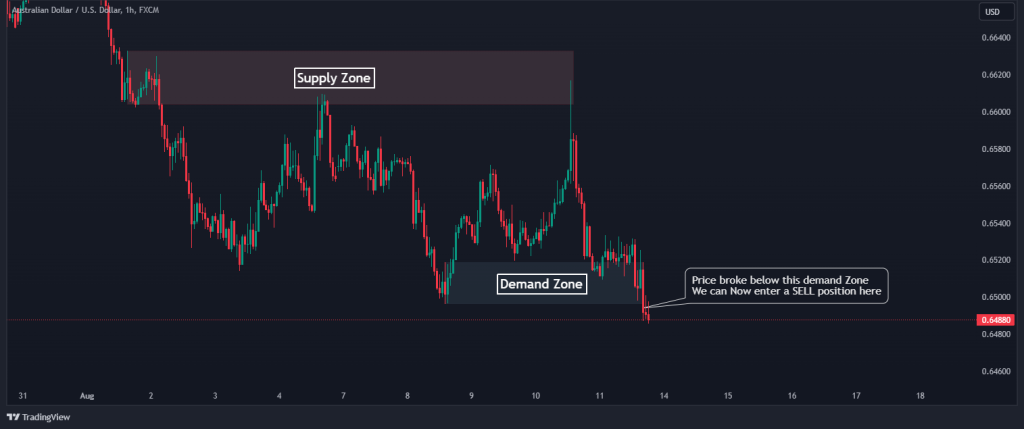
When trading the breakout, you should enter the trade once the price breaks above a supply zone or below a demand zone. For example, let’s say that AUD/USD has been trading in a range, but when the price breaks below the demand level, you should then enter a SELL position, as shown below.
2. Set Your Stop Loss
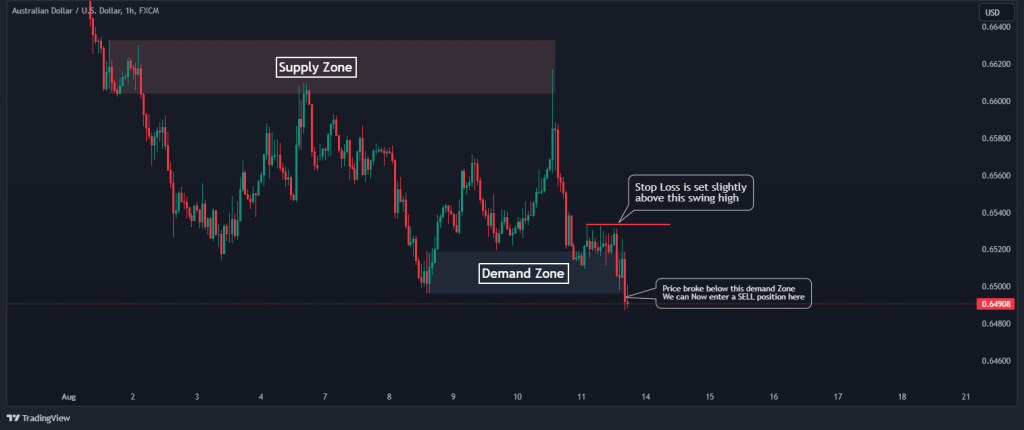
Setting a stop loss while trading a breakout is straightforward. For a bullish breakout (where the price breaks and closes above the supply zone,) you can simply place the stop loss below the last swing point. Now, back to our trade example, all you have to do is place the stop loss above the last swing point before the break of the demand zone, as shown in the chart below. This will limit potential losses if the price suddenly reverses and falls back into the range.
3. Take Profit
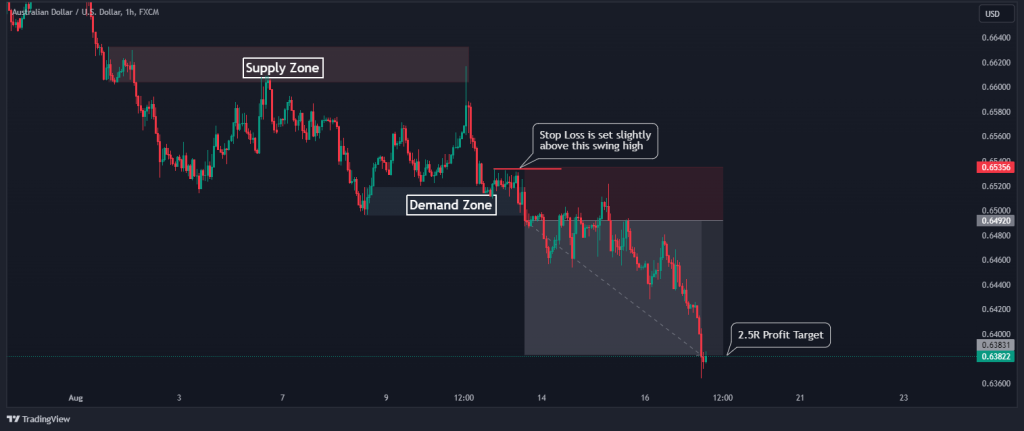
When trading breakouts, placing a take-profit target might be pretty tricky. This is because the price breaks a crucial level, and a significant trend is about to begin. Therefore, the best option is either to set a rigid target profit or set a trailing stop to maximize your profit. For this example, the target profit is set to 3R, as shown in the chart below.
The Supply and Demand Trading Strategy PDF
If you need something to easily carry around and refer to when it comes to supply and demand trading, this PDF is for you:
The Supply and Demand Trading Strategy PDF
Supply and Demand in Forex Trading – Key Takeaways
Here are the key takeaways to keep in mind about supply and demand zones:
- Supply and demand zones appear due to an imbalance between buyers and sellers
- The supply zone appears when there is more selling pressure, while demand zones occur when there is more buying pressure
- Many factors make supply and demand zones, with one of the most significant being the involvement of central banks and large financial institutions
- You can use tools like Fibonacci, chart patterns, longer time frames, and indicators to identify supply and demand zones
- Although you can apply several strategies with the supply and demand zones, two of the most popular are range trading and breakouts
Frequently Asked Questions (FAQs)
Here are some of the most frequently used questions about supply and demand in forex:
How to find forex supply and demand zones?
You can find demand and supply zones by analyzing the trend and locating key areas where the price has reversed or consolidated.
How do supply and demand affect FX currency pairs?
Supply and demand factors can affect the value of any currency. When the demand for any currency increases relative to its supply, its value typically rises in the FX market. Conversely, when the supply of a currency exceeds demand, its value tends to decline.
What increases the demand or supply of a particular currency?
Multiple factors can affect the supply and demand forces of a certain currency. These usually include macroeconomic factors such as interest rates, inflation, political stability, and market sentiment.
Which timeframe is best for supply and demand?
Generally, the longer the time frame, the better. You should look for supply and demand zones on the hourly, daily, weekly, and all-time charts.
Risk Disclosure: The information provided in this article is not intended to give financial advice, recommend investments, guarantee profits, or shield you from losses. Our content is only for informational purposes and to help you understand the risks and complexity of these markets by providing objective analysis. Before trading, carefully consider your experience, financial goals, and risk tolerance. Trading involves significant potential for financial loss and isn't suitable for everyone.