- A ranging market is a condition in which asset’s price trades within a relatively narrow range without showing any clear direction or trend.
- There are three types of ranginf markets: horizontal, diagonal, and triangular.
- Various tools to identify a range market condition include support and resistance levels, Fibonacci retracements, and volume indicators.
It is assumed that markets trend around 20%-30% of the time and spend the remaining time in consolidation. For those looking to capture significant price movement, a ranging market can be an obstacle or a challenging environment to trade in. For others, a ranging market is gold – a perfect trading mode with a low-risk and simple way to trade the markets.
And, as you might already know, in the trading world – if there’s a condition, there’s also a trading strategy for it. That is the range trading strategy.
In this article, we’ll talk about range trading, how you can identify it, and explain the different range trading strategies you can apply to use in forex trading.
Understanding Range Trading
In trading, we are often more drawn to the concept of trend trading. The logic is quite simple – when the price is trending in a clear direction, a trader will attempt to buy the asset at the beginning of the trend and sell when the trend ends.
And so, many of us aim to capture this one significant price movement with the notion that ‘the trend is your friend’. Quite often, we also look at some of the richest traders in the world who, at some point, made a single trade that truly paid off. Indeed, trend trading is appealing.
But in reality, things are more complicated. Most of the time, the markets do not trend. Instead, financial assets usually trade in a relatively narrow range. And there is a good reason for that. After all, financial markets are not there just for people to make money. The pure purpose of financial markets is to create a sophisticated marketplace for all market participants. Therefore, most central bankers, politicians, and economists strive for price stability. In other words, they want ranging markets.
But what exactly is range trading, and how does it work?
First, let’s define what we mean by a range market, also known as a range-bound market. A ranging market is a market condition in which the price of an asset trades within a relatively narrow range without showing any clear direction or trend. In other words, the price is bouncing back and forth between two levels of support and resistance without breaking out of that range.
Much like trend trading, which can be used on any trading technique and time frame, range trading is also used by all types of traders – those who apply the scalping, day, position, or swing trading strategy.
Let’s see an example. Below, you can see an asset’s price movement in a narrow range.

As you can see, the British Pound and the US dollar have been trading in a narrow range between 1.35 and 1.42 for quite a long period. That is a perfect example of a daily-ranging market. But remember, a ranging market can also occur in shorter time frames; hence, 1-Hour, 30-Min, 15-Min, and even 5 or 1-Min.
Range Trading Explained
Here’s a video by our trading coaches on how to use the range trading strategy:
Types of Ranging Markets
When discussing range-bound trading, we have to talk about the three types of ranging markets. Those are:
1. Horizontal Range
Horizontal range is the most common type of ranging market, where the price moves between two levels of support and resistance that are more or less parallel to each other. The upper level is known as price resistance, while the lower level is known as support.
The chart above is an example of a horizontal range market.
2. Diagonal Range
In this type of ranging market, the price moves between two levels of support and resistance that are sloping or trending in the same direction. This is also known as a trending range, as the price moves in a particular direction, though within a defined range.
3. Triangular Range
In a triangular-ranging market, the price moves between two converging levels of support and resistance. This creates a triangular pattern on the chart, with the price bouncing back and forth between the two levels.
For example, various triangle chart patterns are based on the triangular range-bound market. Those include the ascending and descending triangle patterns and the symmetrical triangle pattern.
How to Identify a Ranging Market?
As mentioned, a ranging market occurs when the price of a particular asset remains in a narrow range for an extended time. However, to range trade, you must first identify a sideways market with clear support and resistance levels.
But fear not; you can easily spot a ranging market with the right tools and techniques. Here are some of those you can apply for identifying a range-bound market.
1. Identify and Draw Support and Resistance Levels
The most basic technique to identify a ranging market is drawing the support and resistance levels. These levels are key to understanding where the price will likely bounce back and forth within a defined range.
Simply put, when you notice the price cannot break above and below support and resistance levels, you should use the horizontal line feature, which is available on any trading platform. You should then draw support horizontal and resistance horizontal lines and use these levels to buy and sell the asset.
2. Add Fibonacci Retracement Levels
Another valuable tool for identifying a ranging market is to add Fibonacci retracement levels to your chart. These levels are based on the magical Fibonacci sequence and can help you identify critical support and resistance levels. Then, you can use the retracement levels to determine potential areas of price consolidation.
To learn more, visit our guide on how to use the Fibonacci retracement tool.
3. Volume and Volatility Indicators
A ranging market is usually characterized by low trading volume and volatility. Therefore, assets with low volatility and trading volume typically are better for trading ranging markets.
Moreover, regardless of the chosen asset, you should also look for low trading volume and volatility to confirm a range-bound market.
Indicators such as the Average True Range (ATR) and Bollinger Bands measure volatility. For volume, you can apply volume indicators such as On-Balance-Volume (OBV) and the Chaikin Oscillator.
4. Use Technical Analysis Indicators
You can also use technical indicators to identify a ranging market. For example, the Average Directional Index (ADX) is certainly among the best indicators for determining the strength of a trend. At the same time, the Moving Average Convergence Divergence (MACD) can help you identify changes in momentum.
The stochastic oscillator, Commodity Channel Index (CCI), and Relative Strength Index (RSI) can also help identify potential range-bound markets.
Many successful traders are those who know how to make small profits in ranging markets.
How to Trade a Ranging Market – A Simple Range Trading Strategy
Unlike trend trading, trading a ranging market can be tricky, as the asset’s price action moves within a relatively narrow range and without showing any clear direction. A ranging market occurs when the price of a particular asset remains in a narrow range for an extended time, which means you should generally have a neutral view of the market.
With that, different from trend trading, the most notable feature of range trading is that it enables a trader to trade inside a range while waiting for a breakout to occur and trade it. This helps traders combine two very effective methods using the range trade strategy.
Let’s see how it works.
Trading the Range – Buy at Support and Sell and Resistance
The first and most conventional technique to trade the range is to identify a horizontal range and use support and resistance levels as zones of entry and exit levels. The idea is that as long as the price stays within the range, a trader should exploit this opportunity; hence, buy at the support level and sell at the resistance level.
To do so successfully, here are some of the steps you should follow:
- Identify support and resistance levels using technical analysis tools like trend lines, Fibonacci levels, and moving averages.
- Buy at support and sell at resistance levels.
- Place stop-loss orders below support or above resistance levels.
- Set take profits at the previous high or exit the trade when the price moves closer to the support/resistance levels.
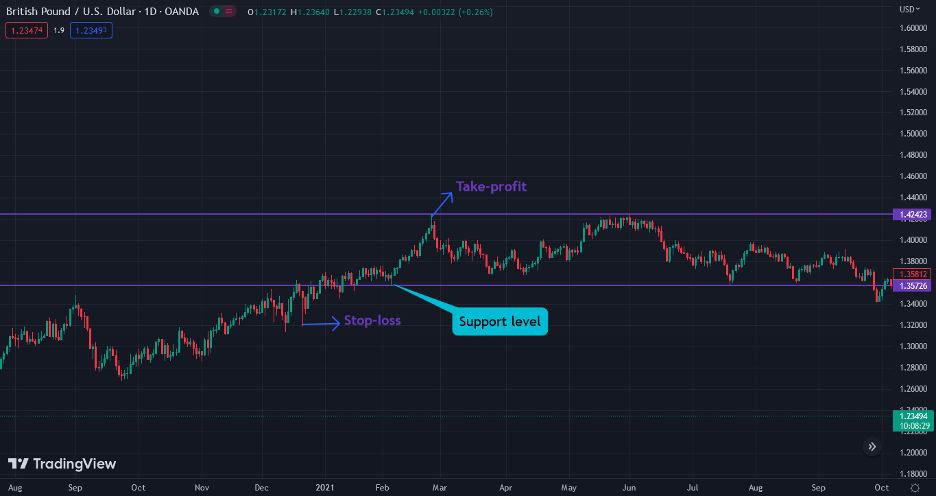
In the GBP/USD chart above, you can see that once the price hovers around the support level, you should enter a long buying position. Stop-loss is placed below the support line, and take profit is located around the resistance level.
Trade the Breakout – Enter a Position When the Price Breaks The Range Area
Obviously, an asset’s price cannot stay in a range forever, which means it will break above or below the resistance or support level at some point. So, if you want a more aggressive approach to trading a ranging market, you can wait for the breakout.
As the range ends, the probability of a significant breakout increases, and you can capitalize on this by switching to a breakout strategy. Whenever the price breaks above or below the established support or resistance level, you can then enter a trade in the direction of the breakout, with the expectation that the price will continue to move in that direction. Certainly, when the sideways market ends, you’ll be much more confident about entering a position as the asset presumably takes a clear direction after a period of consolidation.
To trade the breakout, you need to:
- Wait for the breakout to occur and confirm the new trend’s direction.
- Enter a trade in the direction of the breakout.
- Place a stop-loss below the resistance line when the price breaks the upper level and above the support level when the price breaks the support level.
- Set a profit target at the previous price swing’s highest or lowest level.

As you can see in the above chart, when the price breaks the range’s lower level, the direction is quite clear, and a new trend begins. Also, keep in mind this rule – the longer the range, the greater the breakout.
Range Trading Strategy – Pros and Cons
Range trading can certainly be an effective strategy; however, like almost every strategy, it has pros and cons.
Pros
- Range trading relies on well-defined support and resistance levels, making it easy to identify entry and exit points
- Range trading is a low-risk strategy compared to trend-following strategies. Since you are buying at support and selling at resistance, you can limit losses by placing stop-loss orders below support or above resistance levels
- Since the market is moving within a range, you can profit by buying low and selling high repeatedly, making consistent profits over time
- With range trading, you can combine the range trade strategy and the breakout strategy
Cons
- False breakouts are a common occurrence in range trading. A false breakout is when the price breaks above or below the established support or resistance level but fails to continue in that direction
- To succeed, you have to be patient and wait for the price to move in a specific range
Learn to Trade Ranging Markets with HowToTrade
As markets trend just around 20%-30% of the time, you must learn how to use the range trading strategy to make profits in sideways markets. In fact, even though becoming a trend trader is far more appealing, as we often hear about those who made a fortune from one trade, the opposite could be the truth. Many successful traders are those who know how to make small profits in ranging markets.
If you wish to learn more about the range trading technique, we at HowToTrade, are here to help you achieve this goal. With full support and training from our professional trading coaches and access to our trading academy – you’ll be able to learn how to utilize the range trading strategy, get tips from our mentors about specific ranging markets, and much more.
Frequently Asked Questions (FAQs)
Here are the most frequently asked questions about the range trading strategy:
Is range trading a good strategy to use?
Range trading can be an excellent strategy to use in certain market conditions. This is because it relies on well-defined support and resistance levels to locate entry and exit points, making it easy to execute.
However, its effectiveness depends on factors such as the market conditions and your ability to identify and trade it correctly.
What is the best indicator for range trading?
There is no single “best” indicator for range trading, as different range traders prefer different indicators based on trading style and preferences.
Still, some popular indicators used for range trading include moving averages, Bollinger Bands, and the Relative Strength Index (RSI). You should use these indicators to identify support and resistance levels and determine when the market is overbought or oversold.
What is a daily trading range?
A daily trading range refers to an asset’s high and low market prices during a single trading day. It is a measure of the volatility of an asset and can be used to determine potential entry and exit points for trades.
What other tools can I use for trading ranges?
In addition to technical analysis tools like trend lines, moving averages, or Fibonacci retracements, you can use other tools to trade range effectively. Two such tools are Level 2 market data and order flow analysis.
Level 2 is a trading platform feature that displays an asset’s real-time bid and ask prices, along with the number of shares or contracts available at each price level. It allows you to see the depth of the market and gauge the buying and selling pressure at different price levels.
Order flow analysis is a trading technique that involves analyzing the flow of orders into the market. It can provide insights into the buying and selling pressure at different price levels and help identify potential support and resistance levels within a trading range.
Risk Disclosure: The information provided in this article is not intended to give financial advice, recommend investments, guarantee profits, or shield you from losses. Our content is only for informational purposes and to help you understand the risks and complexity of these markets by providing objective analysis. Before trading, carefully consider your experience, financial goals, and risk tolerance. Trading involves significant potential for financial loss and isn't suitable for everyone.