Should I stay, or should I leave? Is this the right trade? How can I know when to enter and exit trades?
That’s a big part of being a day trader – taking decisions, and many of them. Just imagine that some traders take hundreds of trades in a single trading session. And every decision counts. So, how can you improve your trading performance as a trader? How can you make trading decisions with more confidence?
- Decoding Confluence: Understand what confluence in trading is and how it can be a game-changer in your trading strategies
- Improve Decision Making: Learn how using confluence can bolster your decision-making process, leading to more confident and potentially profitable trades
- Strategic Entry and Exit: Discover how confluence can guide you to determine the most strategic points for entering and exiting trades
- Boost Trading Performance: Uncover the potential of confluence to improve your overall trading performance and maximize profits
Why not try confluences? Have you heard of them? If not, then in this guide, we explain what confluence in trading is and how you can find them to increase the chances of success.
What is Confluence in Trading?
Confluence in trading is using more than one trading approach or analysis method to improve your chances of winning a trade. In other words, to verify the validity of a prospective buy or sell signal, you apply multiple trading indicators that all provide the same signal.
Think about confluence as a combination of trading methods when one technique validates the other, and you get the perfect trade when you combine them. That is why the term confluence is derived from the concept of merging two methods or a place where two rivers meet.
So, in simple terms, the confluence trading definition refers to a merger of two or more techniques to create multiple trade signals lining up on your price charts.
Now, coming back to trading. Let’s say the average Joe trader identified a possible reversal price zone based on resistance and support levels. However, before entering the trade, he looked at the moving averages indicator to validate the trend reversal.
Ultimately, the trader found that moving averages also indicate a high possibility of a trend reversal. Then, after checking it through the RSI technical indicator – all three show the likelihood of a reversal. So, he took a trade and bagged himself some profits.
And, that is what confluence in trading is all about.
6 Key Components of Confluence Trading
Okay, confluence in trading may seem attractive, but how do you apply it? How do you use this trading concept to increase your chances of success? Well, there are several methods to find confluences in trading. Let’s see some of them.
1. Confluence Trading with Technical Analysis Indicators
One of the best ways to find confluence is by combining two technical indicators. This way, two indicators that give the same type of signal help you determine whether or not to enter the trade. It increases the likelihood of a profitable trade and filters out false signals.
For example, on the chart below, you can see the combination of MACD and Stochastics. As you can see, they confirm each other and ensure a high possibility of a reversal in the price action.
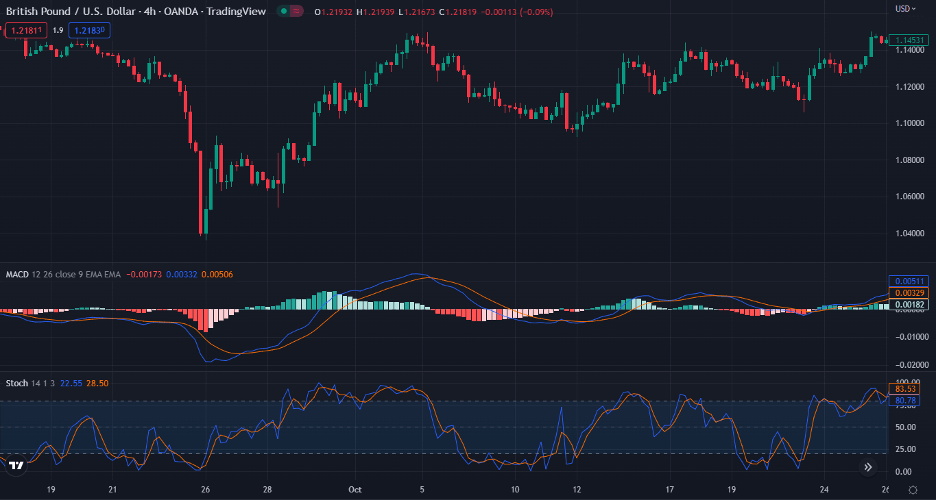
The Stochastic indicator primarily gauges whether an asset is overbought or oversold. At the same time, the MACD indicator is a trend-following indicator that depicts the connection between a 26-day and a 12-day EMA, from which the MACD and the signal line are calculated.
Let’s see another example. Below are the RSI (Relative Strength Index) along with Moving Averages.
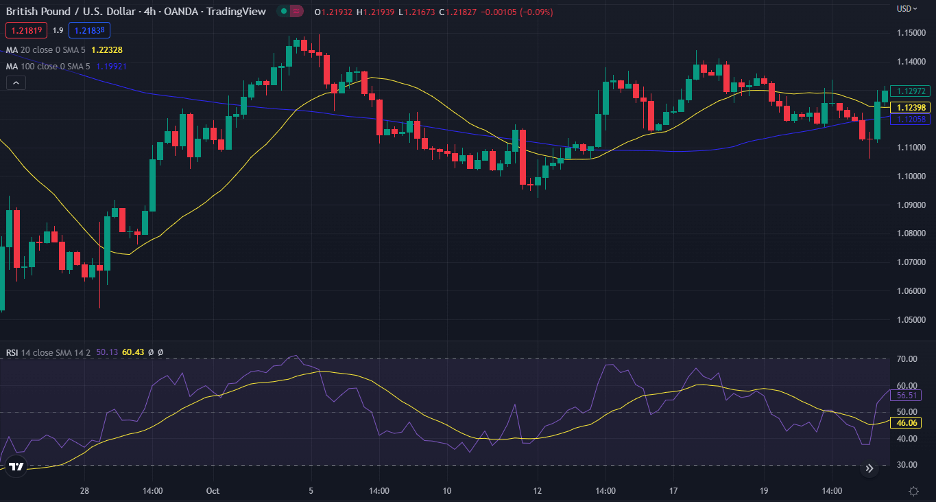
Once again, the moving average signals are confirmed using the RSI. The RSI’s mid-level is 50, and a reading over 50 indicates bullish momentum. On the other hand, when it falls below 50, it suggests a bearish trend.
For that matter, when moving averages provide a signal, you may utilize the RSI to determine whether the momentum is strong enough to justify entering the trade.
However, there is a problem we need to discuss. The issue with combining two indicators is that when a trader employs two or more trend indicators, they both may indicate that the trend is stronger than it is, since both indicators give a green light, but that may only sometimes be the case.
Remember, indicators are an extra tool, but you should only partially rely on them to make trading decisions. Also, before finding confluences based on a combination of two indicators, you should backtest your trading strategy for a few months to see if it is profitable.
2. Chart Patterns and Fibonacci Retracement Levels
You’ve probably heard of Fibonacci retracement and extension levels. Traders often use these support and resistance levels to spot trend reversals or corrections/pullbacks in the markets to join an existing trend or spot price levels where the price is likely to reverse. These retracements and extensions measure price movements based on the magical Fibonacci ratios and are shown as horizontal lines at various levels on the y-axis.
After you’ve learned how to use the Fibonacci Retracement tool and the Fib levels are drawn on your price chart, your attention is usually on a price rebound above or below certain levels. So, before making a directional move, the price may bounce around these levels multiple times. That may be annoying and costly if you enter a trade every time the price reaches a specific Fibonacci level.
To filter this, how about we combine Fib with chart patterns?
Chart patterns are repetitive lines and shapes formed on price charts and are used to help traders predict future price movements, such as breakouts and reversals. Now, when you combine Fibonacci retracement levels and chart patterns, you may use them to fine-tune your market entry and exits as strategic setups. It’s an ideal trading strategy.
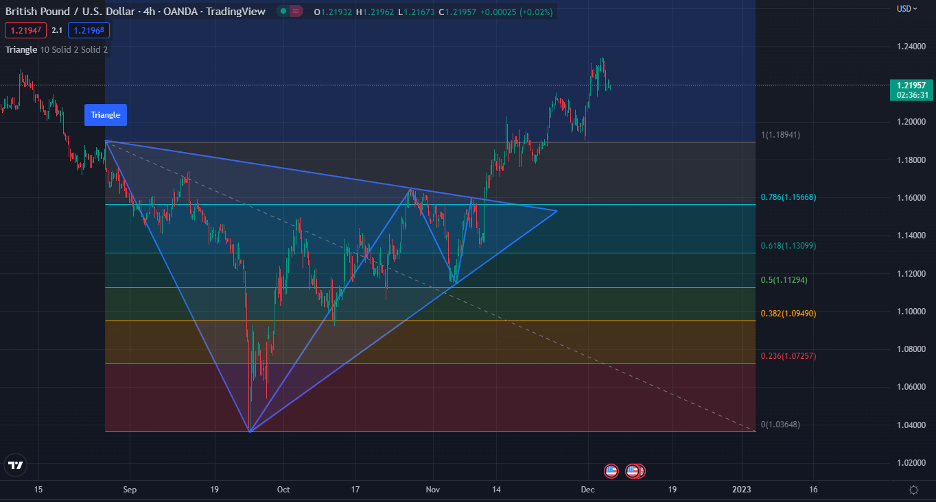
In the chart above, you can see the butterfly pattern along with the Fibonacci levels. You can also see how both of them perfectly predict the market reversal price movement.
BONUS: Feel free to check and download our chart patterns cheat sheet.
The trend line alongside resistance and support levels can also come in this category.
3. Trading Indicators and Level 2 Order Book Strategy
Another way to find a confluence in trading is to combine technical indicators with the Level 2 Order Book.
Traders often use the Level 2 order books to gauge market sentiment. They are particularly useful for short-term traders since they reveal the market sentiment and help retail traders find out if there’s a big buyer or seller in the market who places large order blocks.
While level 2 market data displays orders made at each price, you may still need help to analyze the dominance of buyers and sellers. So, you can combine various indicators to validate the market sentiment.
For example, if an order book shows several large buy orders, and the indicator shows bullish momentum, you can take buy positions knowing that the price will increase. You basically get another confirmation to enter a trade – that is essentially the confluence trading strategy.
Think about confluence as a combination of trading methods when one technique validates the other, and you get the perfect trade when you combine them. That is why the term confluence is derived from the concept of merging two methods or a place where two rivers meet.
4. Combining Fundamental and Technical Analysis
There is a constant debate among the trading community regarding market analysis. Some say technical analysis is the king, while others say fundamental analysis is all that matters. But most people agree that combining both and forming a confluence is the best way.
For instance, while many fundamental traders prefer to focus on the long term, they likely want to receive a reliable buy or sell signal. Technical analysis tools can help in this situation. For instance, if the price moves below the moving average and continues moving downward, you may look for a sell position, and vice versa.
Here’s another example. Let’s say a forex trader combines technical and fundamental trading for the GBP/USD. He uses both analysis methods to confirm the entry points. The news came about the Fed’s hawkish response, increasing the USD and changing the sentiment in the forex market, but when he looked at the chart, it suggested otherwise.
Even if the fundamentals are solid, if the GBP/USD is trading below its key moving averages and the Relative Strength Index (RSI) points downward, you should not enter the trade. Therefore, many forex traders use technical indicators to make entries and fundamental indicators to validate them, or vice versa.
In certain situations, fundamentals confirm technical signals, indicating that a big run is on the way. In other circumstances, fundamentals contradict technical signals, suggesting the possibility of a false signal.
5. Multi-Timeframe Analysis
Another useful way to incorporate Confluence into your trading is by considering multi-timeframe analysis. This involves taking trades only in the direction where multiple other timeframes align.
Suppose you’re a day trader on the 15-minute timeframe, multi-timeframe confluence for you may look like having a daily bias, making sure that the 4-hour aligns with your daily bias, and finally, also checking that the hourly chart aligns with everything else. Then, you can go to the 15-minute chart to pick an entry as you normally would. This time, however, you have the confluence of multiple timeframes, and you’re more confident about the direction of the market.
6. Consider Correlating Markets and Currency Pairs
Another key component of confluence in trading is to consider correlating markets. You’ll find that everything is interconnected, and what happens in one market is not necessarily exclusive to that market.
For instance, if you trade Gold, you may need to keep a close eye on the US Dollar Index. Also, if you take a look at the futures market of a particular currency, you can use its trend to determine how that same currency is likely to fare against other currencies. For instance, if the JPY futures chart appears weak, you may expect currency pairs that use the JPY as their quote currency to be bullish.
The correlation even works among currency pairs. EURUSD and GBPUSD, for instance, are correlated pairs, and you may expect what’s happening with one to happen with the other.
How to Improve Your Trading Performance by Using Confluences
Watch this video to learn what confluences are and how they can help you make better trading decisions.
Tips and Tools to Find Confluence in Trading
Now that you understand what price action confluence trading is all about, it’s time to share some tips and tools that may help you trade confluence:
- Backtesting tools show how your confluences may have fared in earlier market situations. You enter strategy specifics like stop-loss, take-profit, position size, etc. Backtesting evaluates the strategy using past market data to see how your confluences may have worked out.
- Demo accounts are available from many brokers and trading platforms. You may use these accounts to practice your trading confluences before putting real money at risk in the market.
- You know how fear and greed can ruin trading. Even if confluences don’t validate, some people will always take trades. When emotions take over, and you can’t find the confluences, it is time to step away.
- The timeframes you choose may affect your outcome on your charts as you analyze the market and your trades. Adjust your time frame and check whether your confluences are meeting.
- Use other traders’ successful trading strategies. Remember that your goal in trading is not to invent a new trading strategy but to make a consistent income using any trading strategy. If someone who is genuine enough in your opinion shares a strategy that works, use it.
What are the Benefits and Limitations of Confluence Trading?
A major benefit of confluence trading is that it helps you boost your confidence in trade setups. Confluence trading forces you to wait for multiple stars to align before entering trades, giving you more confidence that a market move will likely go in your direction.
On the other hand, confluence trading can also limit your trades. If, for instance, you use multiple indicators for trading confluence and you have to wait for them all to agree before entering a position, you’ll have fewer signals than if you only traded an indicator.
Enough talk. Here are some pros and cons of confluence trading
Benefits
- Confluence trading boosts your confidence in your trade setups, making you less likely to get emotional about the trade.
- Trading in confluence may increase your trading strategy accuracy. One indicator may be wrong. But if you pull multiple technical indicators and they all ask you to buy, the market is likely about to rally.
- Confluence trading is at the root of any trading strategy. No trading strategy is based on one trading tool alone. Professional traders use multiple tools to develop entry and exit points and risk management techniques.
Limitations
- Waiting for confluence in trading might limit the number of trades you take.
- Confluence trading may also cause you to miss out on some moves while you wait for the tools in your setup to align.
- Some instruments are incompatible. They hardly give the same signals, so using these instruments may be more limiting than beneficial.
- Novice traders fall into the trap of consulting more tools than they need for confluence trading.
Final Thoughts
So, there you go: now you know what confluence in trading is and the key points to trade price action confluence. As a reminder, confluence in forex trading is essentially any situation where multiple trade signals line up on your charts, indicating that you should enter or exit a trade.
But remember that trading is a broad field; you can’t rely on one particular tool to succeed. Instead, you have to develop your combo and master your price action confluence trading strategy. Eventually, you might even learn to identify confluences naturally on a price chart when you apply the naked trading strategy. And finding confluences to validate your trades can ultimately help you achieve this goal and become a better trader.
Risk Disclosure: The information provided in this article is not intended to give financial advice, recommend investments, guarantee profits, or shield you from losses. Our content is only for informational purposes and to help you understand the risks and complexity of these markets by providing objective analysis. Before trading, carefully consider your experience, financial goals, and risk tolerance. Trading involves significant potential for financial loss and isn't suitable for everyone.