The Fibonacci retracement tool is one of the essential tools that every professional trader must know about.
These Fibonacci numbers, which frequently appear in the physical world, also have an important role in financial markets and in analyzing assets’ price movements. As a result, many traders often use them to analyze price action and find successful trades.
This guide will talk about the Fibonacci Retracement Tool and how you can use it in four easy steps.
- What are Fibonacci Retracements?
- How to Draw Fibonacci Retracement Levels Correctly
- How to Use the Fibonacci Retracement Tool: Step-by-Step Guide
- Fibonacci Retracement Levels – Two Simple Trading Strategies to Keep in Mind
- Additional Tips on How to Trade Using Fibonacci Retracements
- Additional Free Online Fibonacci Retracement Calculators to Help Your Efforts
- Final Thoughts
What are Fibonacci Retracements?
To understand what the Fibonacci retracement tool is and how it works, you must first know about the Fibonacci numbers. These numbers comprise a unique sequence, with each Fibonacci number being the sum of two previous numbers, such as 0, 1, 1, 2, 3, 5, 8, 13, and so forth. In trading, don’t use the numbers as they are. Instead, we use the ratios derived by dividing a Fibonacci number by other numbers surrounding it. The Fibonacci ratios commonly used in trading include 23.6%, 38.2%, 50%, 61.8%, and 78.6%.
For instance, when you divide a number by the number found three places to the right in the sequence, you get 23.6%. For example, 13/55 x 100 = 23.6%. The golden ratio is approximately 61.8%; you can achieve it by dividing the number by the next one, such as 8/13.
The Fibonacci Ratios as Retracement Levels
In essence, Fibonacci retracement ratios are often used as a go-to technical analysis tool by many traders. By mapping out the ratios on the chart from one swing point to the other, the gap between the swing points is divided according to the Fibonacci retracement ratios. Traders can use these levels to predict where the price is likely to retrace. In other words, whenever the price approaches any of these ratio levels, it is likely to pause and, from there, continue or reverse.
While these levels don’t guarantee a retracement, they have occurred often enough that traders are willing to bet their risks on them.
Fibonacci retracement levels provide areas or zones where the price trend could potentially pause and from there, continue or reverse. They are often used as a go-to technical analysis tool for many traders.
How to Draw Fibonacci Retracement Levels Correctly
That’s the most important thing you need to know in order to draw key Fibonacci retracement levels correctly. When drawing critical Fibonacci retracement levels on the chart, you should start from the swing highs and lows of the current market trend.
Now, that can be on any time frame. As long as you find a trend, you can use the Fibonacci retracements as crucial price levels on a chart. You start from the low point to the high point in an uptrend. Otherwise, you should start from the high to the low point in a downtrend.
How to Use the Fibonacci Retracement Tool: Step-by-Step Guide
Let’s show you how to use the Fibonacci retracement tool on TradingView. Note that you can also try it on MT4/MT5, or any other platform you are using to trade.
First, locate the Fibonacci Retracement tool on the left pane of the Trading View platform.

Step 1: Identify High and Low Points
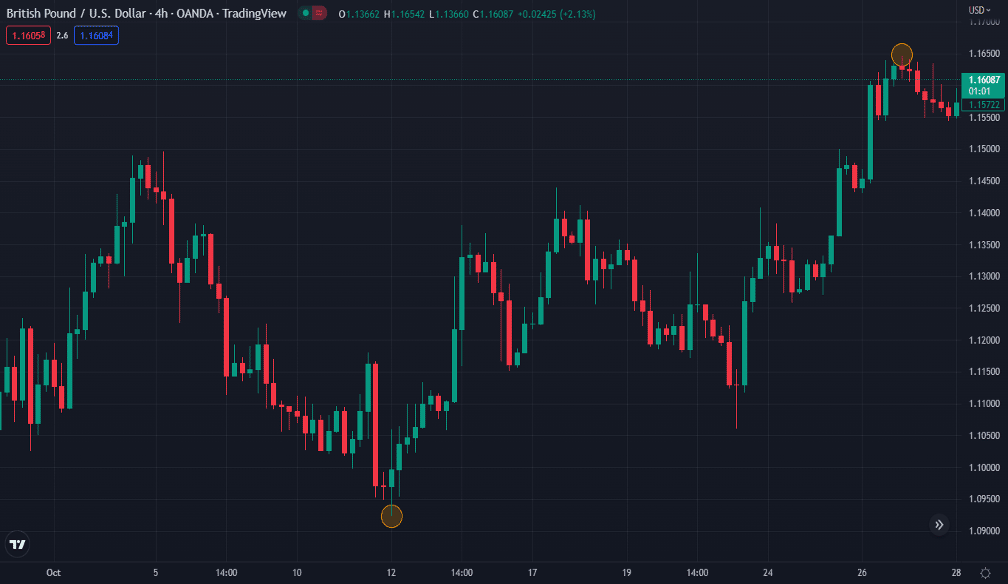
The first step is marking the previous trend’s high and low. Luckily, you don’t need to be an Einstein for this. All you have to do is identify these key levels and locate the lowest and the highest points of the previous price swing.
As you can see on the chart below, we marked the previous trend’s high and low points on a GBP/USD price chart.
Step 2: Draw Fibonacci Retracement Levels
Now the fun step; drawing the Fibonacci retracement tool. After selecting the tool, you start from the swing low point and drag the levels to the highest point in an uptrend and vice versa in a downtrend. Simple as that.
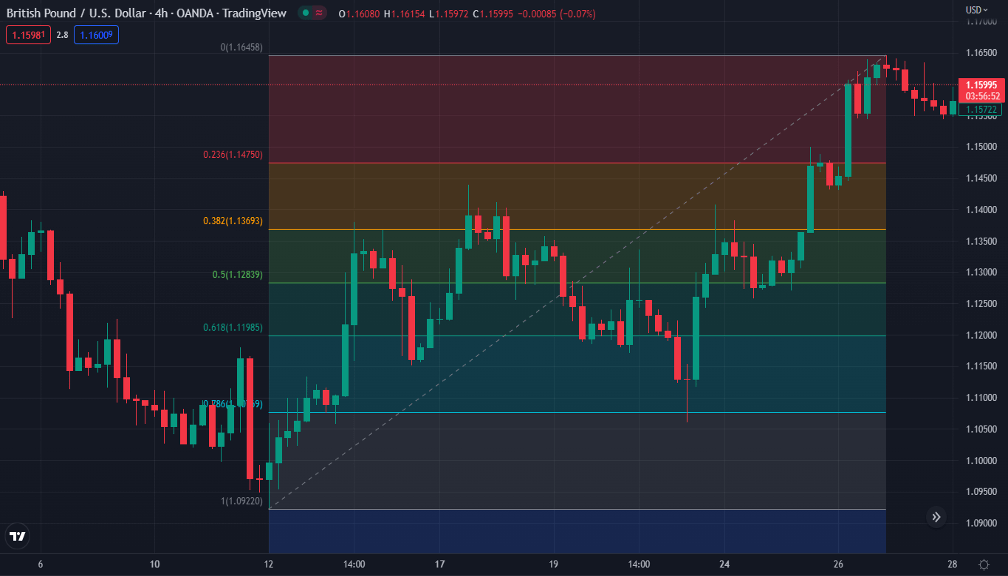
As you can see, we drew the line from the lowest point to the highest point, and the horizontal lines were automatically added to the chart.
Take note that in a downtrend, the opposite happens; you draw the line from the highest point to the lowest point.
Step 3: Find an Entry Level
Now, where do you enter the trade when using the Fib retracement tool?
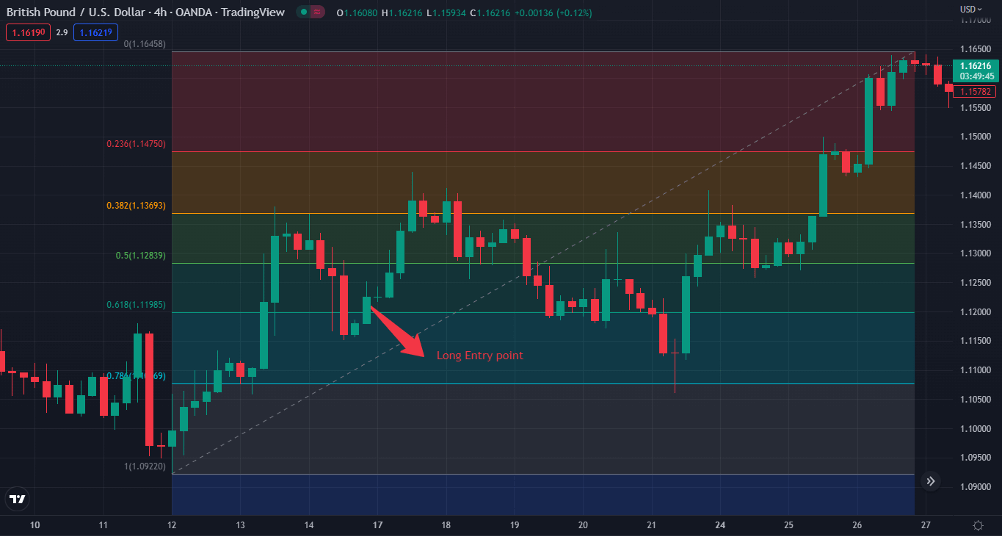
It’s simple; you enter the trade when the price retraces, meaning it pulls back to any of the levels. So, for going long, you can enter the trade when the price dips below the Fib support levels, or as it rises above a certain resistance level. For going short, you can enter when the price goes above the resistance level or falls below the support level. The 61.8% fibonacci retracement level is the most common level used by traders.
It’s important to wait for the price to move upwards/downwards and then enter the trade. This is also the step to use other confirmation tools, i.e., chart patterns and technical indicators.
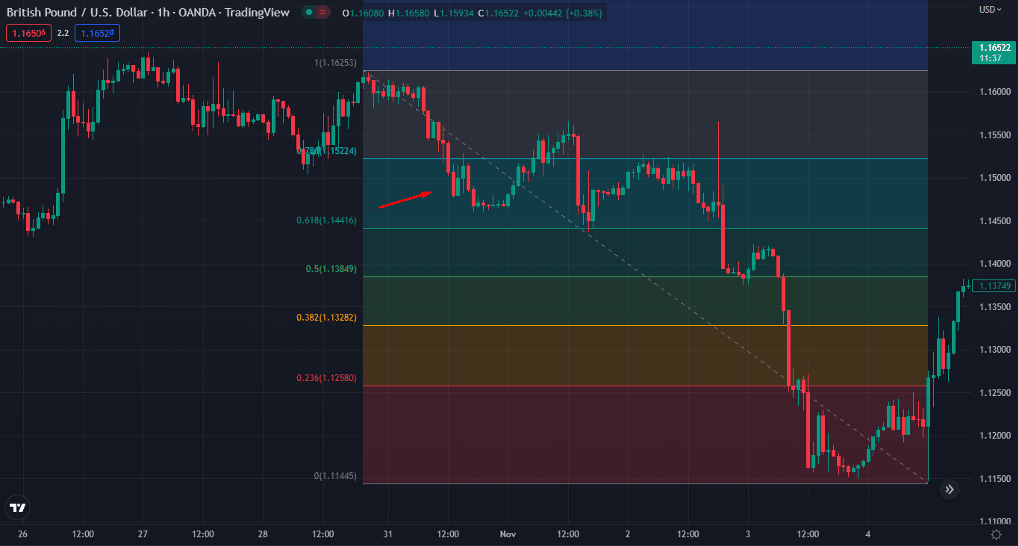
On the chart below, we have marked the long entry point. Notice how the price dips through the Fibonacci Retracement level, presenting us with the buy entry at the 61.8% Fib level.
Step 4: Set Stop Loss/Take Profit
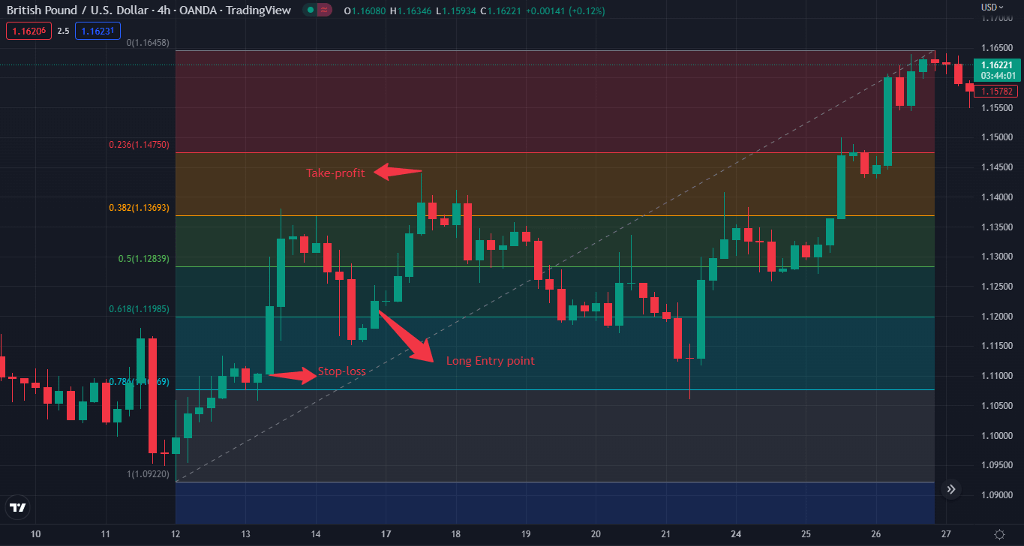
To set a stop-loss, you can place it at the nearest swing high/low from the entry point. As for price targets, you can set it at the nearest high/low from the entry point or exit the trade when the price goes near any of the Fibonacci levels.
In the chart below, we placed a stop-loss near the recent low from the entry point at the 78.6% level and set our profit targets when the price approached the following Fibonacci level at 38.2%.
Fibonacci Retracement Trading Strategies
There are several strategies that can be used in combination with Fibonacci retracement levels. Basically, you can combine Fibonacci ratios with any strategy you wish to implement in the markets – swing trading strategy, day trading, scalp trading strategy, and even position trading.
That said, there are two basic strategies you must know when utilizing the Fibonacci retracement tool: range and breakout trading.
1. Range Trading with the Fibonacci Retracement Tool
Very often, the price moves from one retracement level to another. And when price trades between two well-established zones, a range market environment occurs. So, what are these two zones? Yes, they are support and resistance levels.
Price rises and frequently meets resistance before failing to break higher and finally turning downward. Similarly, the price tends to fall after approaching support before failing to break lower and then reversing upward.
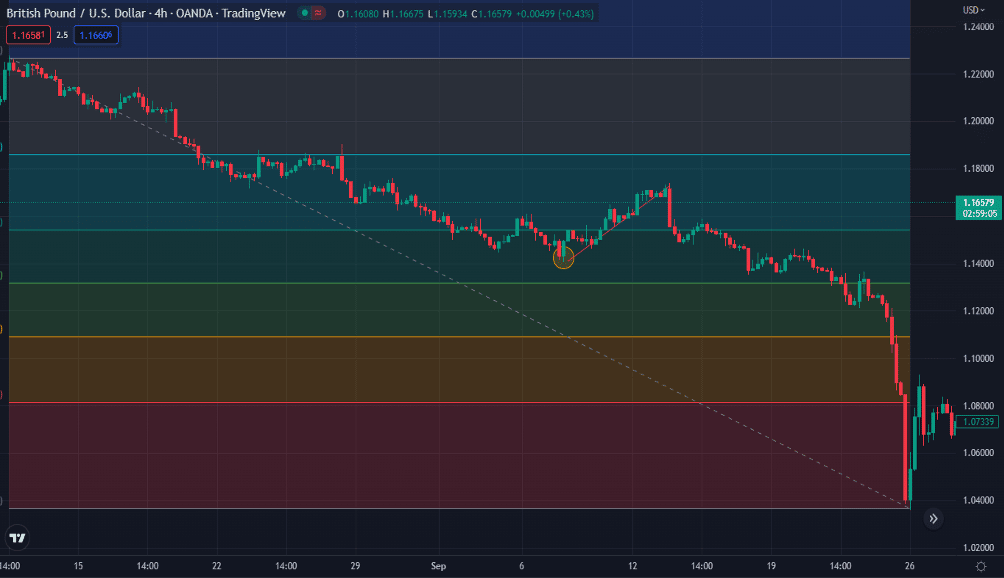
The GBP/USD chart below depicts a region where price levels move between two Fibonacci levels (61.8% to 78.6%) for some time.
In this strategy, you will want to take advantage of the range in the market. Therefore, you will buy the asset at the support level and short-sell it at the resistance level. Once the price breaks above or below one of the levels, you will switch to the next strategy – the breakout trading strategy.
2. Breakout Trading with the Fibonacci Retracement Tool
Think of the breakout as the market situation where something ‘new’ occurs. The market gets out of equilibrium and finds new highs or lows. It could be on an hourly, daily, weekly, or all-time chart. Either way, a breakout is a big thing in trading.
In fact, some traders focus entirely on breakout trading, waiting for the perfect breakout to occur and trying to squeeze the lemon as much as possible.
Now, how does it happen? Typically, after the price moves in a specific direction, it reverses, and the breakout occurs when the price breaks a past unbreakable level.
For example, on the GBP/USD price chart, you can see the price breakout from the Fib level in a downtrend. After the price breaks the lowest level of the day, the perfect entry level would be at the next Fibonacci level. As soon as the price breakout occurs, the price falls sharply to new lows.
Finally, remember that the greater the difference between a Fibonacci retracement tool’s starting and ending points, the more reliable the breakouts. Generally, breakthroughs at 38% and 61%, aka the golden ratio retracement levels, are more effective at entry levels.
Additional Tips on How to Trade Using Fibonacci Retracements
Here are some additional tips to keep in mind when trading the Fibonacci retracement levels:
1. Switch Time Frames
There is a lot of volatility on shorter timeframes, and many beginners need to avoid plotting the retracement levels on shorter timeframes. When the trading volume increases, volatility can change the support and resistance levels on shorter timeframes, and you cannot identify these levels properly.
So, what’s the solution? Simply, you must draw these levels on a longer timeframe and then return to the shorter timeframes for taking positions.
2. Combine Fibonacci Retracements with Chart Patterns and Technical Indicators
Yes, the Fibonacci tool is great on its own. But it’s more reliable and accurate with additional confirmation. This is known as confluence in trading, which simply refers to using more than one trading analysis method to improve your chances of winning a trade. Using technical analysis tools like chart patterns and technical indicators will help you make more accurate decisions and increase your chances of success.
For instance, some of the best indicators to confirm retracement levels include the Relative Strength Index, moving averages, Stochastic Oscillator, and Bollinger Bands.
Additional Free Online Fibonacci Retracement Calculators to Help Your Efforts
Drawing Fib levels and locating them for the perfect entry point might take time and effort, especially if you are a beginner. Additionally, many people who prefer trading naked do not like trading with Fibonacci lines on their trading charts as they may cause confusion and disrupt their decision-making process.
Fortunately, there are Fibonacci calculators you can find online. At its basic, a Fib calculator can calculate these levels for you, and many traders use these calculators to be alert to crucial price levels.
So, with that in mind, here are some of the most popular free Fibonacci Retracement calculators you can find:
A Fibonacci calculator calculates Fib support and resistance levels for you. Many traders often use these calculators to be alert to crucial price levels.
Final Thoughts
Many traders apply the Fibonacci retracement tool to identify crucial support and resistance levels and know where and when to enter their positions. Does it always work properly? Obviously not.
It’s not financial advice and may not work in all market circumstances. However, it is an essential tool to have in your arsenal (we also suggest you download our Fibonacci Cheat Sheet). Moreover, many traders worldwide use Fibonacci levels, which makes these numbers even more crucial than you might think.
So, we suggest you use the Fibonacci Retracement too to analyze the markets. After all, these numbers are an integral part of nature!
Risk Disclosure: The information provided in this article is not intended to give financial advice, recommend investments, guarantee profits, or shield you from losses. Our content is only for informational purposes and to help you understand the risks and complexity of these markets by providing objective analysis. Before trading, carefully consider your experience, financial goals, and risk tolerance. Trading involves significant potential for financial loss and isn't suitable for everyone.