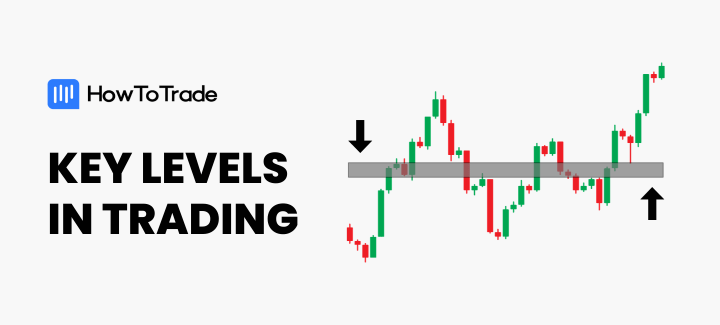
- Key levels in trading are crucial price points that have historically proven to be significant in the market’s behavior.
- Breaking through key levels can indicate a shift in market sentiment, either bullish or bearish, guiding traders’ perceptions of market trends.
- Some of the best tools for determining key levels include the Fibonacci tool, horizontal lines, pivot points, etc.
Key levels are a big thing in trading. These psychological price levels are usually areas where buyers and sellers meet for a battle. And, if there’s a battle, then you need to know about it.
Therefore, understanding and mastering how to trade these key levels is a crucial skill for any trader.
In this guide, you’ll learn:
- The definition of key levels
- Why key levels are important for traders
- Tools and techniques to find key levels
- An example of how to trade with key levels
What Are Key Levels in Trading?
Key levels in trading are specific price points on charts that are significant to the market’s psyche, where the price of an asset has shown historical importance.
For instance, have you ever watched a stock or currency pair and noticed how it seems to bounce off certain prices? Those are normally key levels at play. In trading, these levels are the points where a trader can pause and consider, “Is this where the trend continues, or does it break?” These key levels are pivotal in helping traders decide entry and exit points, stop losses, and understand potential price movements.
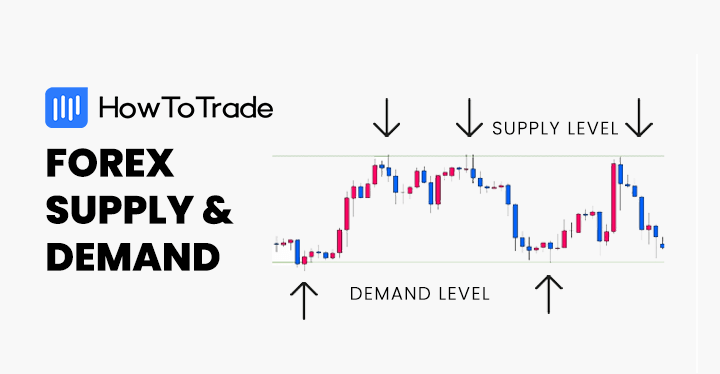
But what makes a price level key? It’s not just any random number; it’s a price that has been touched, tested, and respected multiple times. These supply and demand levels are forged by the collective memory of the market, where historically, the price has either bounced back due to high demand (support) or dropped due to high supply (resistance).
You might wonder how these levels gain their significance. It’s a mix of psychology and history. Traders remember the past behavior of the market at these levels and plan their trades in anticipation of history repeating itself. It’s the self-fulfilling prophecy of trading; because everyone believes in the importance of these levels, they act in ways that reinforce them.
It’s worth mentioning that key levels are not just a single price point but can be a range or support and resistance areas where the price has tended to consolidate or reverse.
Why Are Key Levels Important in Trading?
Now that we know what these key levels are, let’s see why they command such respect and attention.
Firstly, key levels embody the herd behavior in the markets. Picture the financial markets as a vast ocean where traders, like schools of fish, often move together. When many traders fixate on certain price points, their collective actions can lead to self-reinforcing market movements.
Now, let’s take another example and look at the psychology of round numbers. Why do we gravitate towards them in everyday life? Is there something magical about a price tag that reads $19.99 rather than $20? In trading, round numbers hold a similar psychological sway. They are easy to remember, and hence, they often become focal points where stop losses are clustered. When Bitcoin touched $20,000 or $50,000, you could hear many conversations about it. Round numbers create interest.
What’s more, have you ever noticed how a stock might suddenly plummet or soar as it crosses a round-number threshold? That’s often the result of numerous stop losses being triggered at a key level, catapulting the price into a sharp move.
For example, notice a spike on the EUR/USD chart below as it crosses the 1.00 price point.
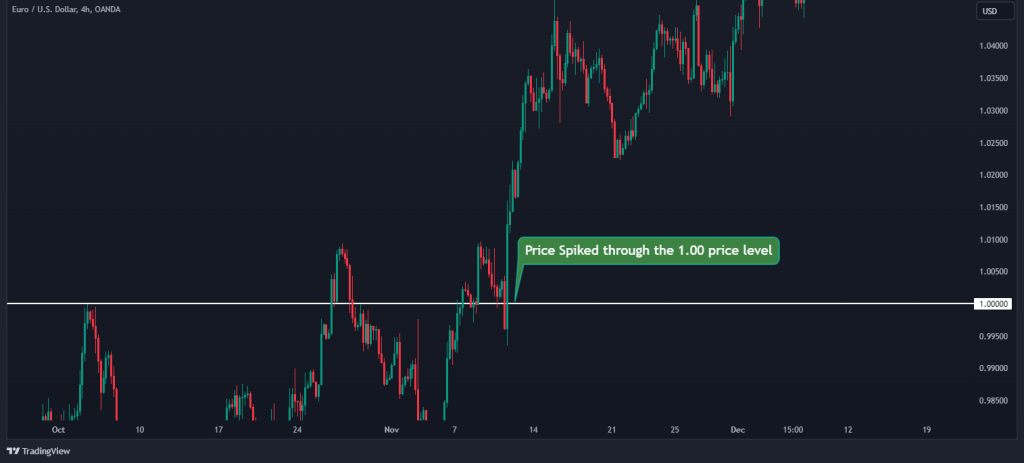
Surprising? Well, not really. Stop losses are frequently set at these key levels. When the price hits these points, a cascade of stop losses can be triggered, leading to increased volatility. This volatility is not random; it’s anchored in the collective behavior of market participants who have placed their bets on these critical price points.
Moreover, support and resistance levels serve as reference points where traders can gauge whether the market is bullish or bearish. If a price breaks through a key resistance level, it may signal that the bulls have taken over, pushing the market higher. Conversely, if a price falls through a support level, the bears might be in control, indicating a potential downtrend. These key levels are simply price levels where buyers and sellers battle for control.
How to Find Key Levels in Trading (8 Tools and Techniques)
Let’s take a closer look at some of the most commonly used tools to find these key levels in trading.
But first, here’s a list of tools and techniques to help you find key levels in trading:
- Fibonacci Retracement Levels
- Horizontal Lines
- Round Numbers
- Moving Averages
- Volume
- Trend Lines/Trend Channels
- Pivot Points
- Previous Day’s High or Low and All-time High/Low
You can watch the video below to learn more about the different key levels trading strategies:
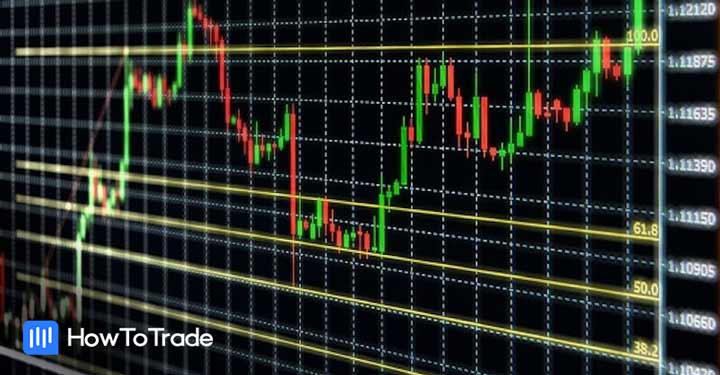
1. Fibonacci Retracement Levels
The first and probably the best tool to find key levels is the Fibonacci retracement tool. This tool is used by many day traders, and as such, the levels it generates become critical for every trader who analyzes the markets.
To effectively use the Fibonacci tool to identify key levels, it is crucial for a trader to initially identify the most recent significant high and low points on a price chart for the asset in question.
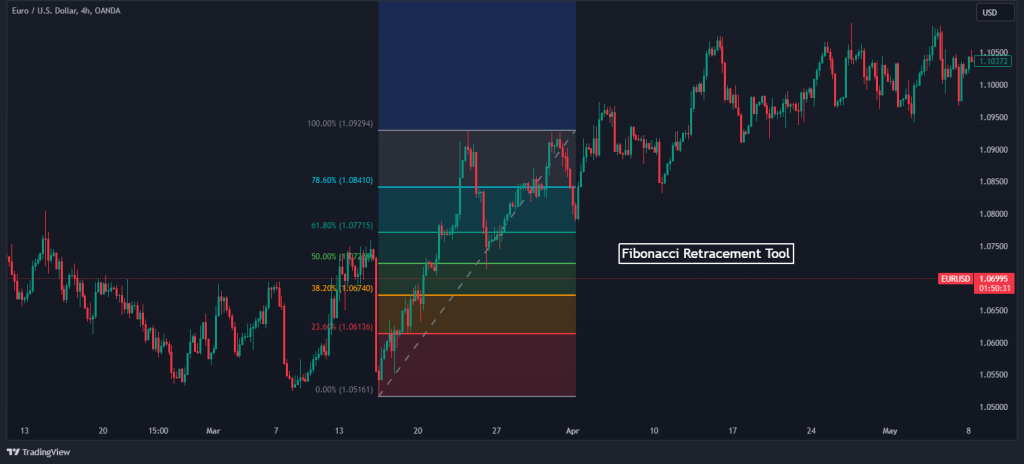
As you can see, after drawing Fibonacci levels, every Fibonacci level becomes a key price level. These points typically correspond to the highs and lows of price swings.
Subsequently, the tool should be extended from the low to the high during an uptrend or from the high to the low during a downtrend. The resulting horizontal lines, which are drawn at Fibonacci ratios, indicate potential key levels where the market is likely to react.
2. Horizontal Lines
Another easy way to find key levels is to use horizontal lines where you notice the price cannot break certain price levels. After all, it’s not rocket science, and your eyes can tell you pretty much everything you need to know.
To find these horizontal key levels, traders look for price points on the chart that have consistently served as barriers to the price movement, either preventing a rise above (resistance) or a drop below (support). These levels are not fleeting; they are established over long durations, often visible over months or years.
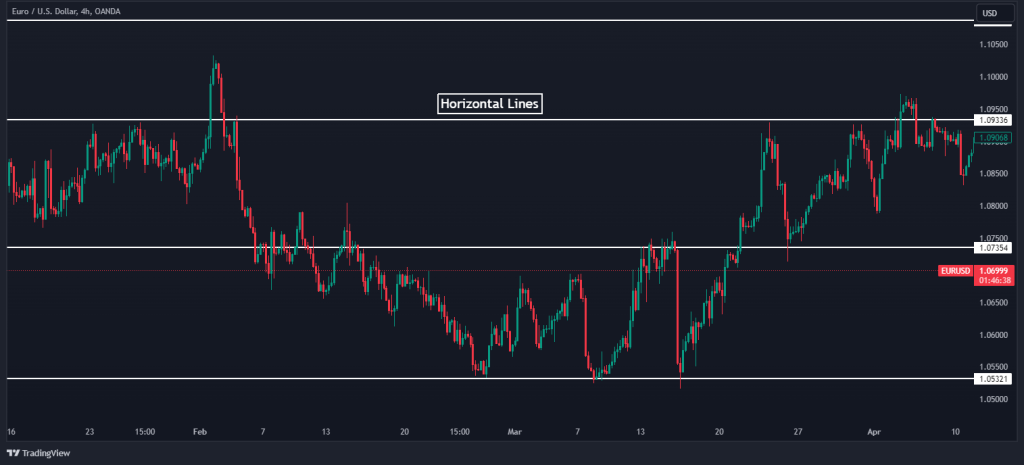
The practical approach to locating these levels starts with historical chart analysis, marking out where price reversals have frequently occurred. By drawing a horizontal line at these points, traders can visualize the key levels.
It’s important to note that the significance of these levels grows with the number of times the price has touched but not crossed them.
3. Round Numbers
Round numbers are psychological levels in trading. Why do we often set price targets at round numbers? Because they stick in our minds, as well as in others. Traders tend to place orders at these levels, making them self-fulfilling prophecies.
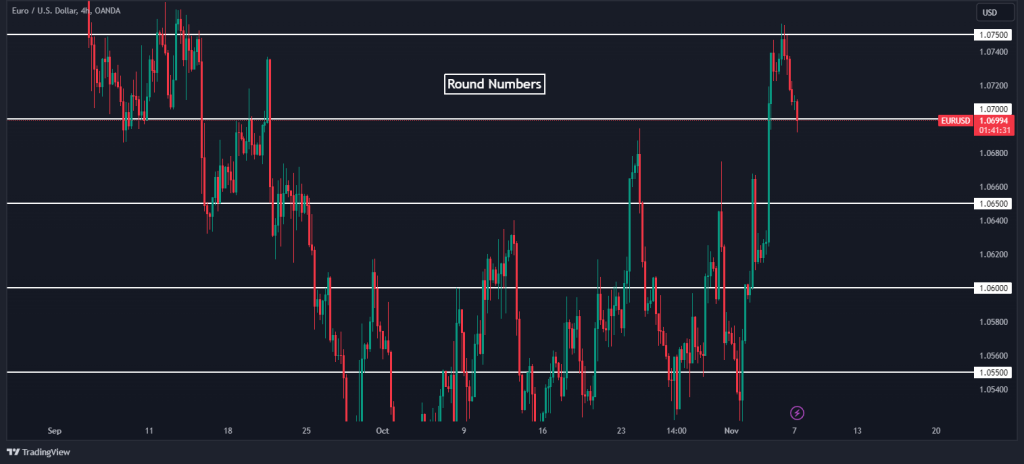
A currency pair that approaches a round number like 1.07000 or a stock nearing $100 per share is more likely to see increased activity. These numbers are like magnets, attracting price movements towards them.
4. Moving Averages
Key levels don’t always have to be horizontal or static. Sometimes, they can be dynamic, and this is where moving averages play a good role, as they are constantly recalculating to reflect the latest price data. They smooth out price action and filter out the noise, providing a clearer picture of the trend.
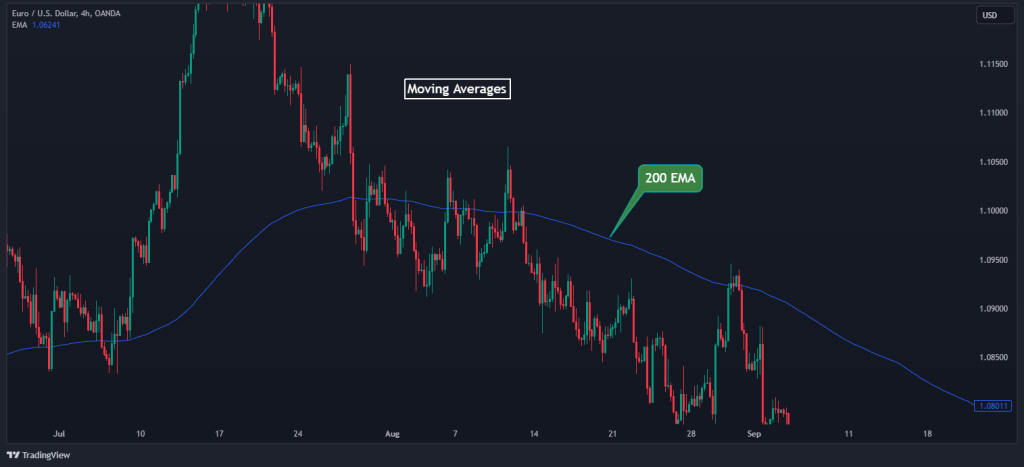
Traders often look at popular moving averages like the 50-day, 100-day, or 200-day to identify key levels. These averages often act as temporary support or resistance because many market participants have their eyes on them.
5. Volume
Volume takes a different approach when it comes to key levels. It shows you where the most trading activity took place, essentially highlighting the price levels that attracted the most money. Usually, when there’s high trading volume, key levels are developed.
These high-volume nodes become key levels because they represent areas of strong interest in buying or selling the asset. When prices return to these levels, you can expect a reaction, as previous buyers and sellers remember the price they valued so highly. To identify areas where there’s high trading activity, you can use various volume indicators, such as the VWAP indicator or the Volume Price Trend indicator.
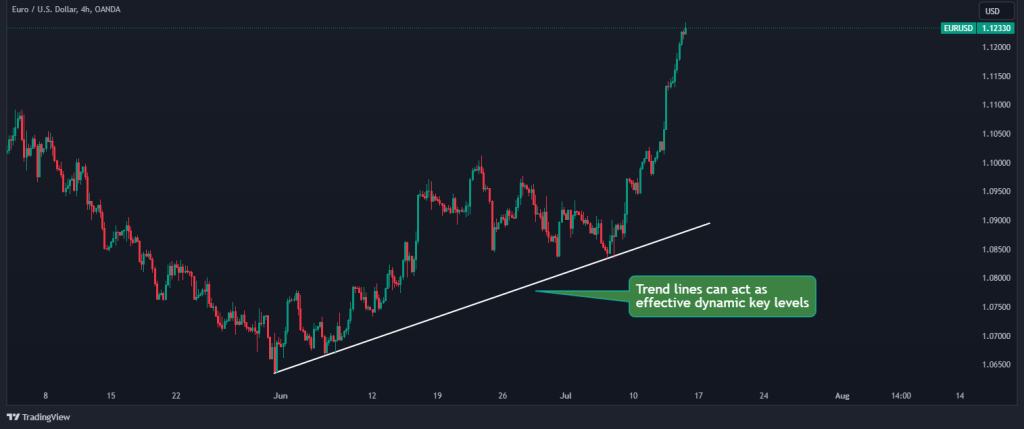
6. Trend Lines/Trend Channels
Trend lines and trend channels are another excellent tool to identify key levels.
Technically, trend lines are drawn by connecting the highs or lows in a price chart, giving you a visual representation of the market’s trajectory. They can be upward, downward, or sideways and act as dynamic key levels. The more times a trend line is touched and respected, the more significant it becomes.
7. Pivot Points
Pivot points are an extremely popular tool among intraday traders. Day and scalp traders widely use pivot points to determine intraday key levels. Calculated using the high, low, and close of the previous day, pivot points give you a set of support and resistance zones — the pivot point itself and several levels of potential support and resistance. In a sense, you can see pivot points as key levels for day traders.
Moreover, since many financial portals present pivot points on their instruments pages, these prices have become even more significant.
8. Previous Day’s High or Low and All-time High/Low
The previous day’s highest and lowest prices strongly indicate the extremes of the previous session’s trading range. These key levels can be used as benchmarks for the current day’s price movement. For instance, if the price breaks below the previous day’s low or high, it can indicate continued selling or buying pressure.
Also, though you don’t see them get breached every day, all-time highs and lows make stronger key levels than daily highs and lows because they represent the extreme points of an asset’s price history. Traders look at all-time highs as levels that, if broken, may indicate a very strong bullish sentiment. Conversely, dropping below an all-time low might suggest a significant bearish outlook, potentially leading to further declines.
Key Levels Trading Strategies and Examples
So, how do we put together all these concepts and ideas to help us develop a profitable key-level strategy? That’s what this section is all about. We will explore two different methods in detail.
Trading Breakouts with Key Levels
When a trend is strong, we often see prices break key levels. These types of market scenarios always lead to what we refer to as breakout entries, utilizing the breakout trading strategy.
Here’s how to trade breakouts:
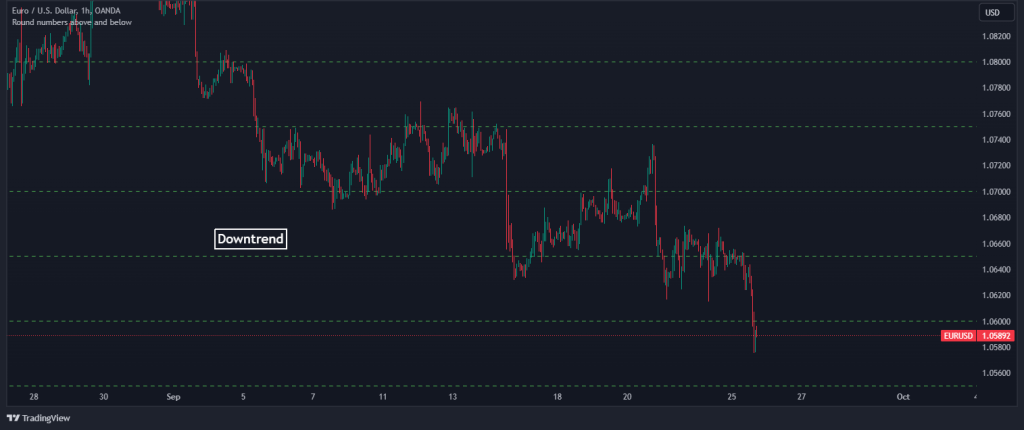
1. Identify the current trend: From the chart below, you can see that EUR/USD is in a clear downtrend. Additionally, we must identify key support levels that the price has tested but not broken through. For this example, we will be using round-number key levels. We use an indicator called “Key levels up and down” on TradingView to automatically identify these levels.
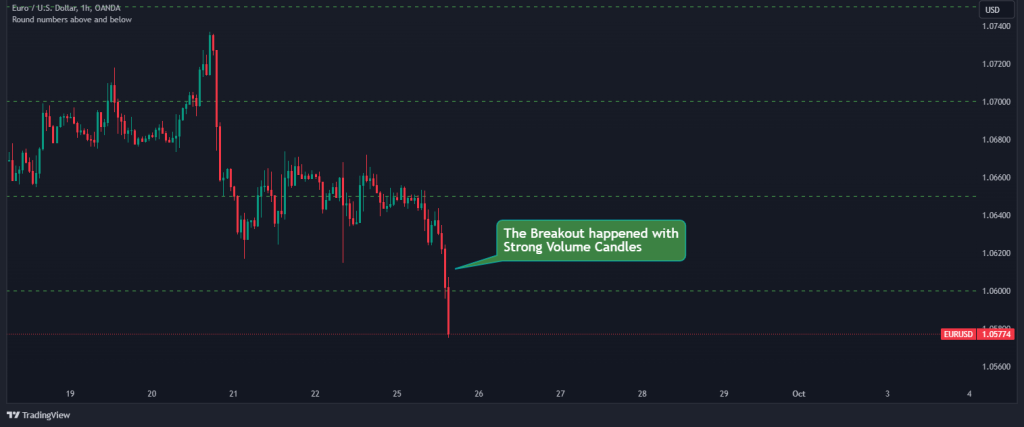
2. Watch for a Key Level breakout: Now that we know the direction the market is heading, we can start to monitor the price action for a strong key level breakout below the support level. The breakout should be on significant volume to validate its strength, as shown below.
3. Trade Entry and Risk Management: After the breakout, you can immediately enter a position if you are a scalp looking for short-term trades. Or, to avoid “fakeouts,” you can wait for the price to retrace back to the broken support level, which now acts as a new resistance level, and look for confirmation signals that the price is respecting the new resistance level, such as bearish candlestick patterns or a bounce off the level.
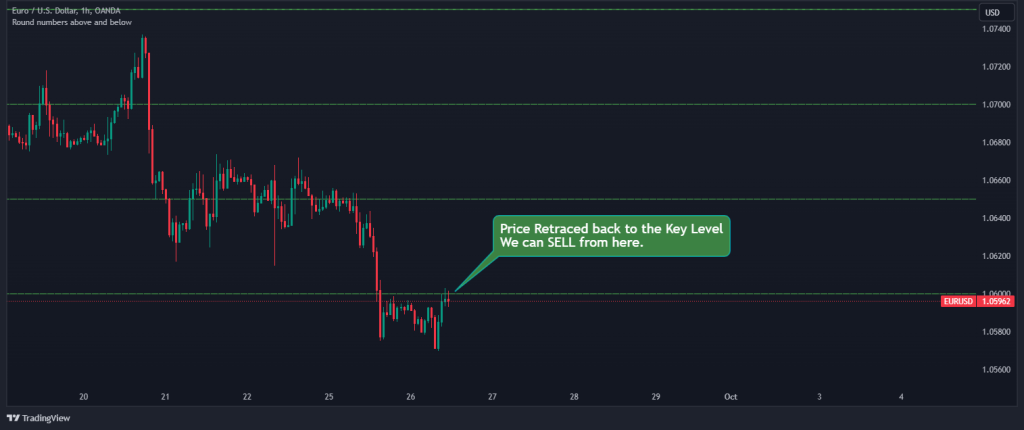
Once the trade meets our criteria, as seen in the chart above, we can enter a short position when the confirmation signals align, setting a stop loss above the new resistance level to manage risk.

Setting our profit targets requires some discretion, but a good rule of thumb is to target 2R. However, we can also set the profit target at the next key level.
Trading Reversals with Key Levels
Another effective way we can trade with key levels is to use them to spot and trade market reversal opportunities. Since key levels in trading often provide an area where a trend might pause and end, it could be a good place to utilize the counter-trend strategy.
Here’s how we go about it in real-time.
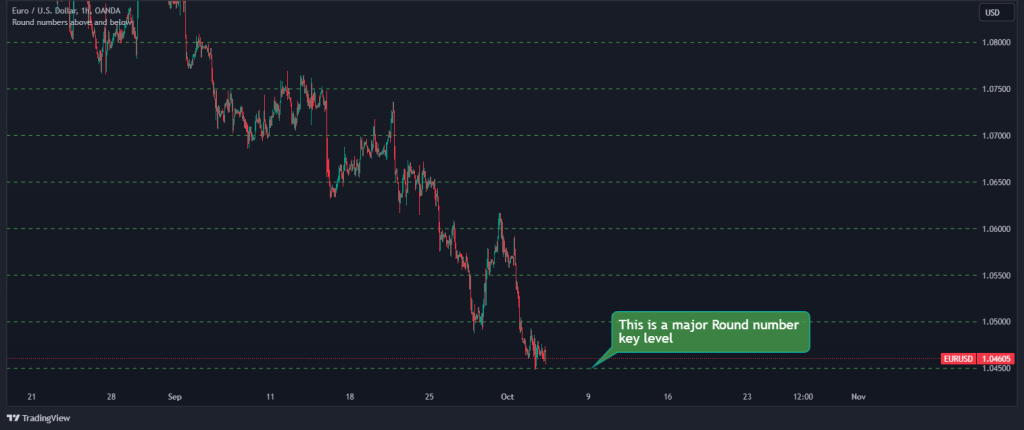
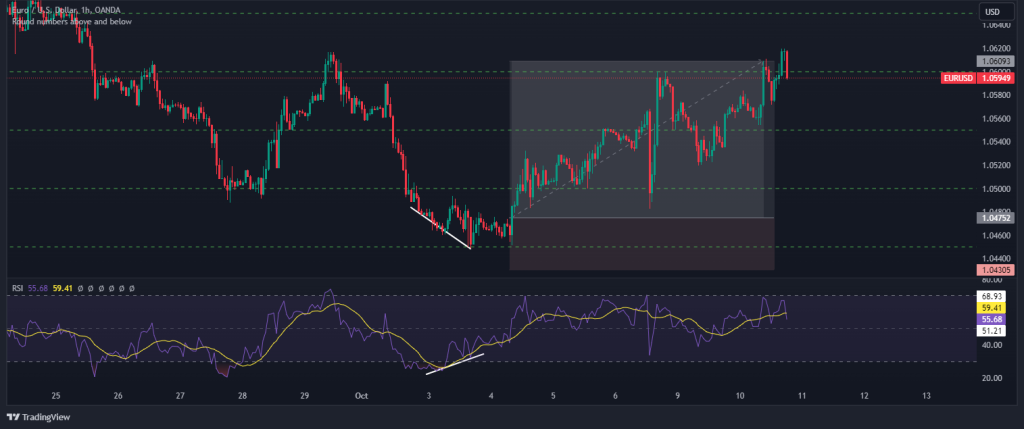
1. The first thing we want to do is to look for key price levels where the market has shown a strong reaction in the past, such as major support or resistance areas or round numbers. We will use round numbers for this example. This is how it looks on the chart:
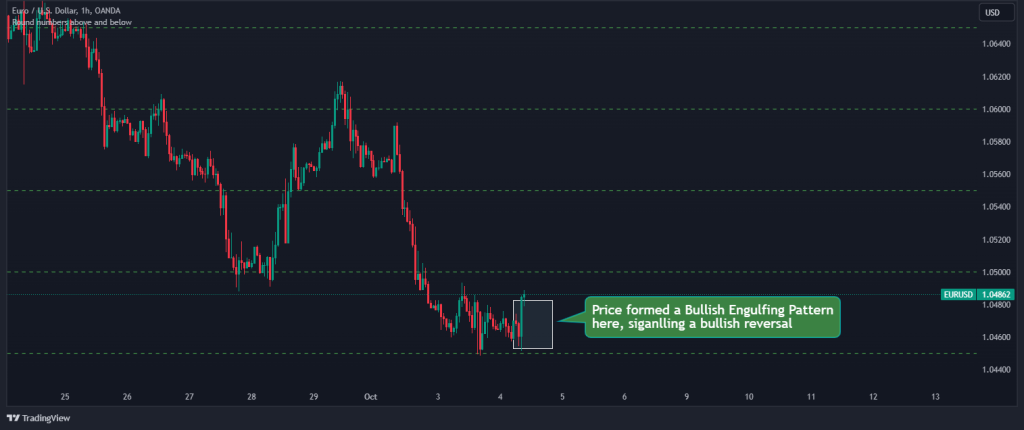
2. Once we’ve identified these key levels, we can monitor these levels for price action that suggests a reversal, like pin bars, engulfing patterns, or other reversal candlestick formations. For example, in the chart below, we can see that the market is forming a bullish engulfing pattern. That’s a strong sign that the market might reverse.
3. While you can place your trades immediately after the second criteria is met, we usually use technical indicators such as RSI, MACD, or Stochastic to confirm overbought or oversold conditions that align with the potential reversal before pulling the trigger. In this case, we can also see that the RSI is oversold, and it is also at divergence with price, giving us extra confluence to enter a BUY trade.
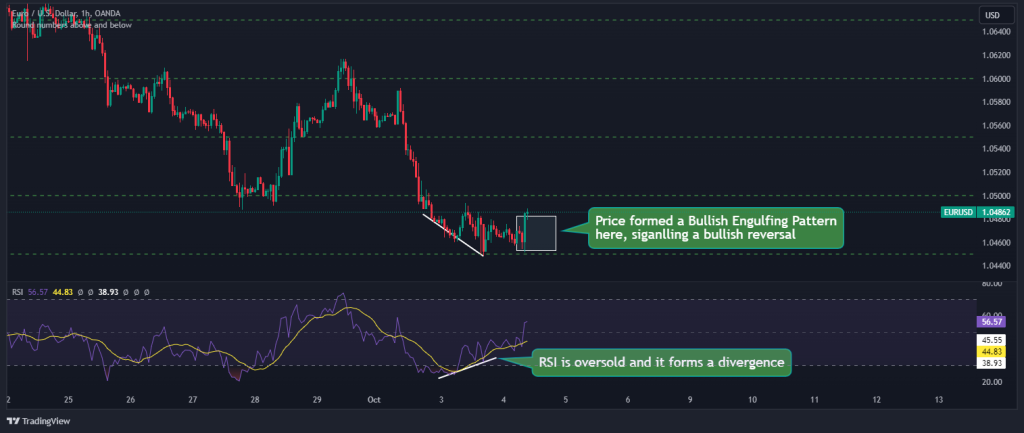
After entering the trade, place a stop loss just below the key level to minimize potential losses if the price does not reverse as expected. Also, for this example, we will set our profit target to 3R.
Remember, trading involves risk, and it’s important to have a clear risk management strategy in place. These strategies should be tested with historical data and practiced with a demo account before applying them to live trades.
The Free Key Level Trading PDF
If you need something to easily refer to when you’re trading, here’s a concise key level trading PDF. It’s free, by the way:
The Free Key Level Trading PDF
Why Do Key Levels Matter in Trading?
So far in this article, we’ve uncovered the significance of key levels, the role of herd behavior in reinforcing these levels, and explained how they can act as catalysts for volatility when numerous stop losses are triggered.
It would be fair to say that regardless of the method you’ll use to analyze the markets, whether fundamental or technical analysis, you must follow these key levels to get a sense of where the market might be heading.
In trading, it’s all about knowing when other people might join the trend or at what price level the trend might pause. And this is why key levels matter in trading.
Frequently Asked Questions about Key Levels in Trading
Here are some of the frequently asked questions on Key levels in trading:
Why should you use key levels in trading?
Key levels in trading offer strategic points for entry and exit, help in setting stop losses and take profits, and provide insights into market psychology, enhancing decision-making and potentially increasing the probability of successful trades.
What are the key Fibonacci extension levels in trading?
Key Fibonacci extension levels in trading are 61.8%, 100%, 161.8%, and 261.8%. These levels are often used to predict potential areas of interest, such as targets and reversal points, beyond the current price range after a breakout.
Is it enough to trade financial markets with key levels?
While key levels provide valuable insights, trading financial markets successfully typically requires a comprehensive strategy that includes understanding market trends, volatility, and other technical and fundamental analysis indicators. As shown in the examples we have provided earlier, key levels should be one component of a multifaceted approach.
Risk Disclosure: The information provided in this article is not intended to give financial advice, recommend investments, guarantee profits, or shield you from losses. Our content is only for informational purposes and to help you understand the risks and complexity of these markets by providing objective analysis. Before trading, carefully consider your experience, financial goals, and risk tolerance. Trading involves significant potential for financial loss and isn't suitable for everyone.