


- The breakout trading strategy involves buying or selling an asset when the market breaks above or below out of a trading range.
- There are primarily two types of breakouts that traders commonly encounter: Continuation Breakouts and Reversal Breakouts.
- Tools like level 2 market data, support and resistance levels and technical indicators can help you trade breakouts successfully.
Of the various trading styles being used in the trading industry, breakout trading comes off as one of the most dynamic and exciting. It’s a strategy that offers the potential for quick gains, making it particularly attractive to traders who thrive on volatility and fast-paced action.
While other styles, like position trading, require patience and long-term commitment, breakout trading takes a more agile approach. Traders using this style always look for those crucial moments when assets “break free” from their established ranges or chart patterns, intending to capitalize on these moves.
But is breakout trading the right style for you? How do you navigate this high-energy trading approach successfully? This comprehensive article will delve deep into the world of breakout trading.
We will explore its core principles, uncover the main strategies employed by breakout traders, and evaluate the benefits and limitations of this trading style. By the end of this guide, you will have a clearer understanding of whether breakout trading aligns with your trading goals and risk tolerance. So, let’s get to it.
- Breakout Trading Explained – The Basics of the Breakout Trading Strategy
- Types of Breakouts in Trading
- Best Tools and Indicators to Trade Breakouts
- The Intraday Breakout Trading Strategy – A Detailed Tutorial on How to Trade Intraday Breakouts
- The Free Breakout Trading Strategy PDF
- Breakout Trading Strategy – Pros and Cons
- Frequently Asked Questions (FAQs)
The Basics of the Breakout Trading Strategy
Breakout trading is based on the principle that when an asset’s price surpasses a predefined support and resistance level, it will likely experience a substantial price movement in the same direction. Traders who employ this strategy aim to seize these opportunities by opening positions as soon as the breakout occurs, expecting to profit from the ensuing price momentum.
Successful breakout trading begins with the precise identification of potential breakout opportunities. Traders use various technical analysis tools and trading indicators to spot assets consolidating within a defined range. Common indicators for the breakout strategy include moving averages, the Ichimoku Kinko Hyo indicator, the Zig-Zag indicator, and the Relative Strength Index (RSI). By carefully analyzing price charts and indicators, traders can pinpoint assets on the brink of a breakout.
While identifying potential breakouts is essential, it is equally crucial to confirm the breakout before entering a trade. False breakouts, where prices briefly breach a support or resistance level but quickly revert, can harm your trading account. To mitigate this risk, traders often look for confirming signals such as increased trading volume or additional technical indicators aligning with the breakout direction.
2 Main Types of Breakouts in Trading
In trading, mastering the art of recognizing and capitalizing on different types of breakouts is essential for success.
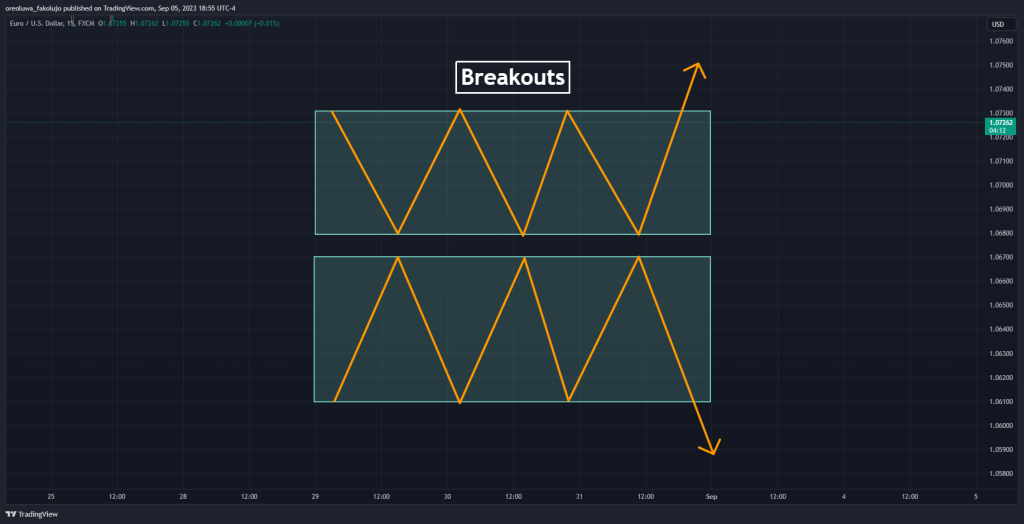
As mentioned, breakouts are pivotal moments when the price of an asset surges beyond a predefined level, signaling potential trading opportunities. And there are primarily two types of breakouts that traders commonly encounter: Continuation Breakouts and Reversal Breakouts.
1. Continuation Breakouts
Continuation breakouts occur within a major trend, indicating that the prevailing market sentiment will likely persist. Traders often look for strong momentum and consistency when identifying these breakouts.

So, imagine you’re monitoring the price chart of a popular asset that has been steadily climbing for weeks. During this upward trend, the asset faces intermittent periods of consolidation, where the price moves within a tight range.
Suddenly, there’s strong buying pressure and the asset’s price breaks above the upper boundary of this range with substantial trading volume. This is a continuation breakout. For that reason, the range trading strategy and the breakout trading strategy are highly connected.
Continuation breakouts suggest that the existing uptrend is gaining strength, potentially offering traders an opportunity to enter a long position confidently. Key indicators like moving averages, MACD, or Bollinger Bands can further validate this breakout and assist in decision-making.
2. Reversal Breakouts
As the name suggests, reversal breakouts indicate a change in the prevailing market sentiment. These breakouts are particularly interesting for traders seeking to identify trend reversals and capitalize on price reversals. Here’s an example to illustrate:
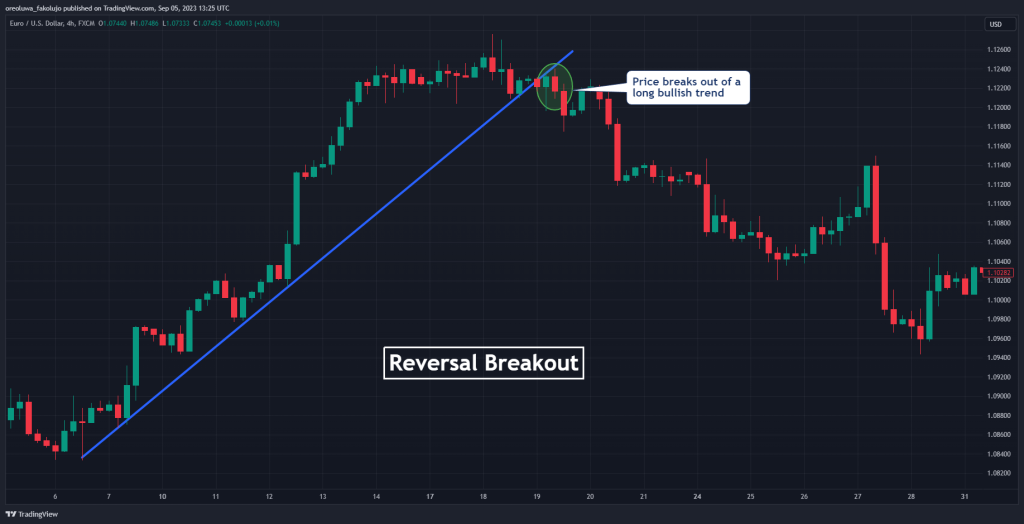
For instance, consider a currency pair that has been in a prolonged uptrend. Traders have been buying the pair, expecting further price increases. However, at a certain point, the price sharply falls with strong selling pressure and breaks below a significant support level, accompanied by increased trading volume. This is a reversal breakout.
Reversal breakouts are often seen as opportunities for traders to exit existing positions or even consider contrarian trades. Technical indicators like divergences or patterns like the Double Bottom, Double Top, Triple Bottom, and Triple Top can provide additional confirmation of a reversal breakout.
Best Tools and Indicators to Trade Breakouts
Obviously, trading breakout can be done intuitively with the use of technical analysis tools. In fact, many breakout traders are pure price action traders who wait for a significant breakout to enter trades. Still, there are some tools and indicators that can help you master the skill of breakout trading.
The following tools enable traders to make informed decisions and capitalize on breakout opportunities effectively.
Level 2 Trading
Level 2 trading is a tool pro traders employ to trade breakouts precisely. It involves monitoring the day’s highest and lowest price levels in real-time. This technique provides valuable insights into market sentiment and order flow.
Level 2 data, often called market depth, displays the orders in the order book. It shows the current bid and ask prices and the volume of orders at each price level. For breakout traders, this information is gold.
Imagine you’re tracking an asset that has been consolidating within a tight range. By monitoring Level 2 data, you can identify significant buy and sell orders near the current price. It’s a breakout signal when you notice a surge in buying orders, pushing the price above the resistance level. Additionally, by monitoring level 2 market data, you can easily see when the price is about to break the highest or lowest level of the day.
If you want to dive deeper into Level 2 trading, consider our comprehensive guide: Level 2 Trading Guide.
Volume and Momentum Indicators
Volume and momentum indicators play a pivotal role in breakout trading. These indicators help traders assess the strength of a breakout and identify potential entry and exit points.
For example, various volume indicators, such as the On-Balance Volume (OBV) and the Volume Weighted Average Price (VWAP), provide insights into trading activity. A surge in trading volume during a breakout can validate its authenticity. High volume often accompanies strong price movements, making it a key indicator for breakout traders.
In addition, momentum indicators like the Moving Average Convergence Divergence (MACD), the Relative Strength Index (RSI), and the Stochastic RSI help traders gauge the momentum behind a price move. Combined with breakout patterns, these indicators confirm whether a breakout will likely sustain or reverse.
Support and Resistance Levels
Support and resistance levels are fundamental concepts in breakout trading. These price levels act as barriers that the price must break through to continue its trend. Here’s how they come into play:
Support levels are price levels at which an asset tends to find buying interest, preventing it from falling further. A breakout above a strong support level signals upward momentum and a potential long-trade opportunity.
On the other hand, resistance levels are price levels at which an asset faces selling pressure, preventing it from rising further. A breakout above a well-defined resistance level indicates strong buying interest and the potential for a sustained uptrend.
Normally, a breakout occurs following a period when the price is trading inside a range. Thus, you must learn how to use support and resistance levels, or Fibonacci support resistance levels. Moreover, learning the concept of the supply and demand strategy can also be valuable in trading breakouts.
A Detailed Tutorial on How to Trade Intraday Breakouts
Intraday breakout trading is a dynamic strategy that is widely embraced by traders seeking to profit from short-term price fluctuations within a single trading day. This breakout strategy hinges on identifying and capitalizing on significant price movements, particularly when an asset’s price breaks either the highest or lowest level it has reached during that day’s trading session. Let’s see how it works.
Breakout Trading Strategy – Break of the Highest or Lowest Level of the Day
The intraday breakout trading strategy is about recognizing key moments when an asset’s price surpasses either the highest or lowest point it has achieved during the trading day or any other timeframe (even an all-time high or low). These breakout points serve as critical indicators of potential price momentum and can present lucrative trading opportunities.
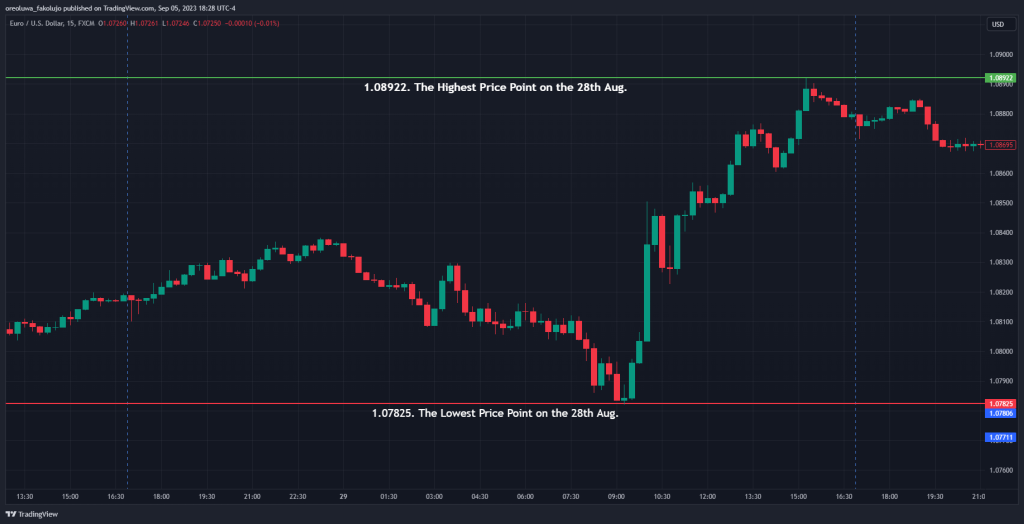
For instance, consider the chart of EURUSD on the 28th of August above. The recorded high of that day was 1.08922, and the low was 1.07825. As the next trading day unfolds, you observe a steady uptrend in the pair’s price, and it eventually breaches the 1.08922 resistance level. This breach signifies a potential breakout, setting the stage for an intraday trading opportunity.
As you can see in the example above, the price reached a resistance level for the second time, which was the highest price level of the previous day. When it breaks above the resistance, a breakout signal is made, and you can enter a long-buying position.
NB: Knowing when the market you’re trading opens and closes can help you trade this breakout strategy better. It helps you know the distance between which to determine your high and low price levels.
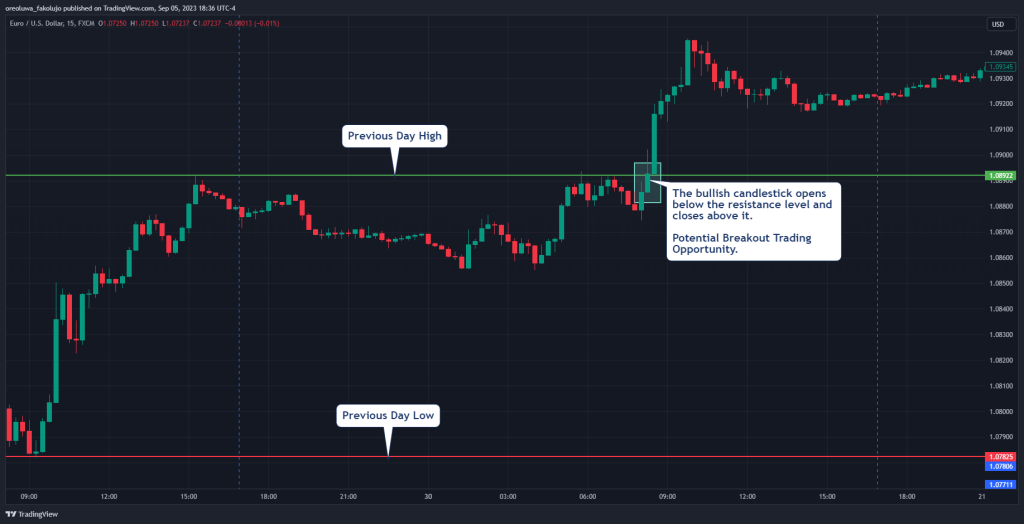
Confirming the Breakout
Identifying a breakout is just the initial step. To validate the breakout and try to catch the high-probability breakout trades, traders rely on various confirmation signals. These signals help reduce the risk of a false break, which can be costly. Some common confirmation techniques include:
Volume Analysis: An uptick in trading volume concurrent with the breakout can bolster its credibility. Increased volume often reflects a heightened market interest in the price movement.
Technical Indicators: Traders often utilize technical indicators like the Relative Strength Index (RSI), Moving Average Convergence Divergence (MACD), or the Aroon indicator to corroborate the breakout’s validity.

In our example, the price breaches the previous day’s high (1.0892) as a resistance level, experiences a surge in trading volume, and shows a positive RSI crossover. These factors serve as confirmation of the breakout’s strength.
Entering the Trade and Implementing Risk Management
When trading breakouts, long positions are typically initiated following a resistance breakout, while short positions may be taken after a support level breach. So, your entry point in our example would be just after the close of the candlestick that crosses the breakout level.
Setting stop-loss orders is crucial to mitigate potential losses. In a buy trade, place your stop-loss just below the most recent swing low before the breakout. Place it just above the most recent swing high in a sell-trade setup.
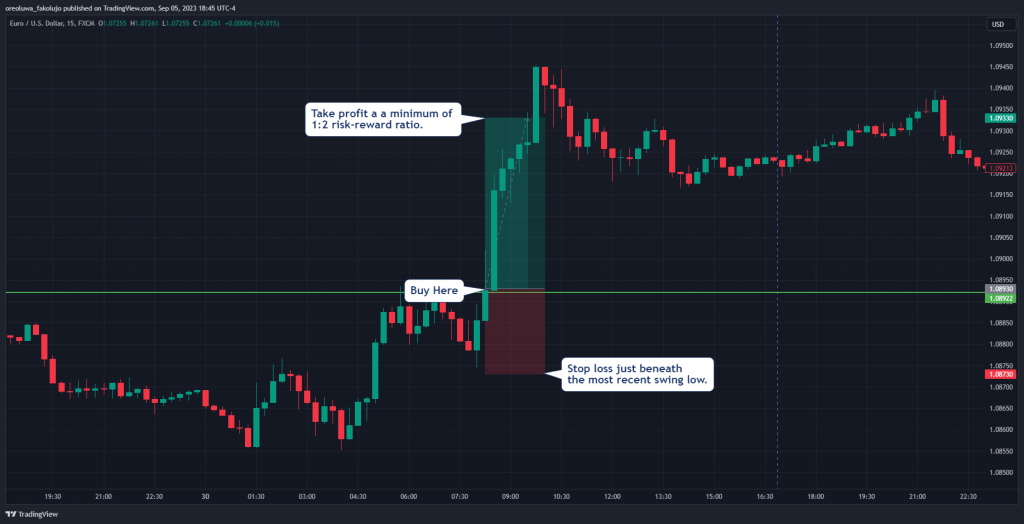
Take your profit at a minimum of 1:2 risk-to-reward ratio. And that’s how you trade breakouts.
The Free Breakout Trading Strategy PDF
If you need something to easily carry around and refer to when it comes to breakout trading, this PDF is for you:
The Free Breakout Trading Strategy PDF
Breakout Trading Strategy – Pros and Cons
When considering any trading strategy, weighing its benefits and limitations is crucial. Breakout trading is no exception. So, here are its pros and cons:
Benefits of Breakout Trading
One of the standout benefits of breakout trading is the clarity of entry and exit signals. Breakouts occur when the price breaches a defined level, providing a precise moment to enter a trade. This clarity reduces guesswork and enhances decision-making.
The breakout trading style is also perfect for trend traders and scalpers. When a financial asset experiences a sustained price movement, breakout traders can ride the trend for potential profits. This aligns with the timeless trading adage: “The trend is your friend.”
Pros
- Breakout trading strategies offer numerous opportunities for entering trades because they happen all the time and on any time frame
- Clear entry and exit signals
- Profit potential in trending markets
- Breakout trading strategies are adaptable across various asset classes
Limitations of Breakout Trading
One of the primary challenges in breakout trading is the occurrence of a false breakout. These are situations where the price briefly breaches a level but quickly reverses. False breakouts can lead to losses and can be frustrating for traders. In volatile or choppy markets, market noise can drown out breakout signals.
Traders may encounter frequent whipsaws, where prices move erratically around support and resistance levels, making it difficult to discern genuine breakouts.
Cons
- No breakout trading strategy completely avoids false breakouts
- Breakout strategies are susceptible to market noise and whipsaws
- Trading breakouts requires patience and skill
Learn to Trade Breakouts with HowToTrade
Learning to trade breakout can be tricky, especially when you do it on your own. But who says you have to do it alone, anyway? After all, that’s why we are here! With HowToTrade, you can learn the breakout strategy alongside other trading strategies.
If this is what you are looking for, we suggest you join our trading academy. You can also check our trading tools, and trading coaching from our experienced trading mentors.
Frequently Asked Questions About the Breakout Trading Strategy
Here are the most frequently asked questions about the breakout trading strategy:
What is the best indicator for the breakout trading strategy?
The choice of the best indicator for breakout trading can vary depending on your trading style and preferences. However, one of the most widely used indicators for breakout trading is the Moving Average Convergence Divergence (MACD). The MACD helps traders identify changes in momentum, which is crucial for confirming breakouts. Other indicators like the Relative Strength Index (RSI) and Bollinger Bands are valuable for assessing overbought or oversold conditions, providing valuable insights into potential breakout opportunities.
What is the best time frame for the intraday breakout trading strategy?
The best time frame for intraday breakout trading largely depends on your trading goals and the level of risk you’re comfortable with. Typically, traders using the intraday breakout strategy focus on shorter time frames such as the 5-minute, 15-minute, 30-minute, or 1-hour charts. These time frames allow traders to capture short-term price movements and capitalize on intraday breakouts. However, it’s essential to remember that shorter time frames can be more volatile, so risk management is crucial. Experimenting with different time frames and adapting your strategy to suit your trading style best is advisable.
What is the break high/low of day strategy?
The “break high/low of day” strategy is a simple yet effective approach traders use. It involves monitoring an asset’s highest and lowest price levels during a trading day. When the market breaks above the high of the day (for a long trade) or below the low of the day (for a short trade), it signals a potential breakout. This strategy is especially popular in day trading and can provide precise entry and exit points.
How can I learn to trade breakouts?
Learning to trade breakouts effectively requires education, practice, and discipline. Here are some valuable resources and steps to get started:
Demo Trading: Use a demo trading account to practice breakout strategies without risking real capital. This allows you to gain experience and refine your approach.
Books: Consider reading trading books on breakout trading. Books provide in-depth knowledge and insights from experienced traders.
Online Tutorials: Numerous online tutorials, webinars, and courses are dedicated to breakout trading. Platforms like YouTube and trading education websites like HowToTrade offer a wealth of free resources.
Mentorship: If possible, seek mentorship from an experienced breakout trader who can provide personalized guidance and advice. Additionally, consider joining a trading community where you can discuss with other successful traders and get information about market news and forecasts.
Real-Time Analysis: Continuously analyze price charts, practice identifying breakout patterns, and use paper trading to track your progress.
Risk Disclosure: The information provided in this article is not intended to give financial advice, recommend investments, guarantee profits, or shield you from losses. Our content is only for informational purposes and to help you understand the risks and complexity of these markets by providing objective analysis. Before trading, carefully consider your experience, financial goals, and risk tolerance. Trading involves significant potential for financial loss and isn't suitable for everyone.