


The Ichimoku Kinko Hyo is a technical analysis indicator that measures the direction, momentum, and strength of trends in the market, effectively helping traders point out trade signals where possible. Its lines also serve as support and resistance lines that give traders further insight into the market dynamics.
- The Ichimoku Kinko Hyo indicator shows the direction and strength of a price trend, potential support and resistance levels, and entry and exit positions at a glance.
- Line crossovers and cloud breakouts are essential strategies for placing trades.
- It is a great tool to work with independently but may be combined with other indicators like the RSI and MACD.
This article will help you to understand the Ichimoku Kinko Hyo indicator and how to apply it to your trading strategies. It also discusses the benefits and limitations of the tool to give you a perspective on its reliability. Without much further ado, let’s get right into it.
What is the Ichimoku Kinko Hyo Indicator?
The Ichimoku Kinko Hyo indicator is a versatile and comprehensive trading tool that will enhance your trades. Developed by Goichi Hosoda, a Japanese journalist in the late 1930s, the indicator seeks to give traders a holistic view of the market situation at a glance. “Ichimoku Kinko Hyo” simply translates to “One look equilibrium chart.”
It is used for detecting and measuring the direction, momentum, and strength of trends in the market. The interactions between the lines of the indicator and price action result in definite trade signals that can yield encouraging profits.
Here’s what the indicator looks like on a price chart:

As you can see, aesthetically, the Ichimoku is not the best indicator. But beauty is not the most important thing, especially in trading. As an all-in-one indicator, the Ichimoku provides three things about the market – the trend, the strength of the trend, and support and resistance levels. It is perhaps the most informative and detailed indicator. And that’s why it could be such a valuable tool for traders and investors.
How Does the Ichimoku Kinko Hyo Indicator Work?
Now, let’s understand how the Ichimoku Kinko Hyo indicator works. In terms of its display, the Ichimoku Kinko Hyo indicator comprises five main elements grouped into the market’s past, present, and future. The elements are:
| Kumo | Kijun-Sen | Tenkan-Sen | Chinkou Span |
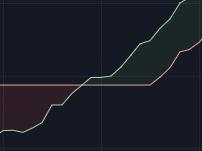 |  | 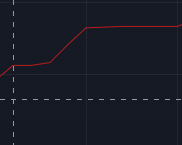 |  |
- Tenkan-sen (the red line, also known as the baseline) is a conversion or turning line derived by summing the highest high and the lowest low over the past nine periods and dividing it by two.
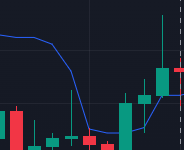
- Kijun-sen (the blue line) is a baseline calculated by finding the average between the highest high and the lowest low over the past 26 periods.
- Senkou-Span A, also known as the leading span, is a leading line evaluated by adding Tenkan-sen and Kijun-sen, dividing the result by two, and plotting the line 26 period in advance.
- Senkou-Span B is a second leading line calculated by adding the highest high and the lowest low over the past 52 periods, dividing the result by two, and plotting the line 26 periods in advance. The area between the two Senkou lines is called the Kumo Cloud.
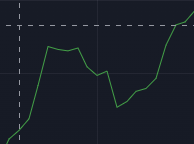
- Chikou span (the green line, also known as the lagging span) is a line that simulates the movement of price action. This line is the current period’s closing price plotted 26 days back on a price chart and is primarily used to identify support and resistance levels.
These elements form the present, past, and future of the market. The present comprises the Tenkan-sen and Kijun-sen. Since Tenkan is the smaller moving average, the line appears more volatile on the chart, with price action crossing it more often than Kijun. Chikou represents the market’s past because it reflects the behavior of price action moved by 26 periods, signifying a lag.
Finally, the market’s future is the Ichimoku cloud itself, bound by the Senkou span A and B lines. If Senkou Span B’s weighted moving average is below the lighter Span A, it signifies a bullish trend. The cloud region appears in a light color in the space between the two lines. Conversely, when Senkou Span B is above Span A, it signifies a bearish trend, and the cloud region turns darker.
We discuss further the interactions between these lines and price action and their implications in the next section.
How to Use The Ichimoku Kinko Hyo Indicator in Trading
The Ichimoku Kinko Hyo indicator is available on major platforms, including TradingView. You can input values for the parameters Tenkan, Kijun, and Senkou span B based on your preferences, although the default values of 9, 26, and 52 work well on many timeframes.
The interactions between the lines and price action show different Ichimoku trading strategies for getting into trades. In this section, we look at four trade signal strategies: trend identification, crossovers, trend confirmation, and cloud breakouts. Now let’s take a deeper look into these concepts.
1. Trend Identification
The Ichimoku Kinko Hyo indicator does a great job of identifying trends. The indicator clouds, the region between Senkou span A and B, serve as tools for identifying a bullish or bearish trend. The appearance of price action above the cloud region indicates a bullish trend.
When the price is below this cloud, it signifies a bearish trend. Also, in a bullish trend, the Senkou Span A and Span B lines switch as the bullish cloud becomes light. In a bearish trend, the cloud becomes dark and the indicator provides a sell signal.
However, the indicator’s lines appear horizontal in a ranging market, with price action hovering around it. The cloud also shortens in width, and its colors change very often. Therefore, the Ichimoku Kinko Hyo can also be very useful when utilizing the range trading strategy.
2. Crossovers
You also want to pay close attention to the crossovers between the Tenkan-sen (the conversion line) and Kijun-sen (the baseline). This may offer excellent trading signals for a market’s future price movement. When the conversion line crosses above the baseline, this indicates a bullish crossover, identifying a potential long opportunity in the market. Conversely, when the conversion line drops below the baseline, it shows a bearish crossover. Prepare to get into a short position.
3. Cloud Breakouts
The cloud’s Senkou Span A and Span B lines also act as support and resistance levels for price action. When the price breaks out from inside the cloud above it, this is a bullish breakout, suggesting a buy-entry position. The reverse is valid for a bearish breakout.
4. Confirmation
In addition to the signals that help you identify trends and crossovers, waiting for the Chikou Span to cross above and below the price can help you increase confidence before placing a trade. When the Chikou span crosses above the price, this confirms your bullish sentiment. The reverse occurs when the Chikou span crosses below the price- a potential sell opportunity.
Ichimoku Kinko Hyo Indicator Trading Strategy Tutorial
Now that you have a broader knowledge of the Ichimoku Kinko Hyo indicator, its components, and how it works, let’s look at a practicable way to trade the markets using the indicator.
Note that in the below strategy, we combine all the signals provided by the Ichimoku to ensure the indicator signal’s accuracy. Those are the crossover, a Chikou span validation, and the Ichimoku cloud breakouts.
Ichimoku Kinko Hyo Trade Entry
To spot trade entries with the Ichimoku, you can aim to identify crossovers between the Tenkan-sen and Kijun-sen lines of the indicator. When the Tenkan-sen crosses above the Kijun-sen, you have a potential buying opportunity. Conversely, a short position is imminent when Tenkan crosses below the Kijun.
In the EUR/GBP chart below, you can see two market scenarios where the crossovers between the Tenkan-sen and Kijun-sen lines provide a strong signal to enter a trade.

Next, confirm your signals further with the position of the Chikou span relative to price. A Chikou span above price validates a long position. The reverse is obtainable for a short position.

Finally, look out for cloud breakouts by price action. They provide helpful information for trend continuation and reversals. Place a long position when the price breaks out from inside the cloud and above it. When it breaks below it, enter a short position.

Take Profit
Use the Senkou span A and span B lines of the Ichimoku cloud as areas of support and resistance to taking a profit. One way to do that is to take profit when price action touches any of the cloud lines, as that suggests the end of the prevailing trend with a possible reversal.

Stop Loss
Place your stop loss above or below the candlestick that breaks out of your Kumo cloud.
Ichimoku Kinko Hyo Indicator – Pros and Cons
The Ichimoku Kinko Hyo indicator gives a wide range of information about the market, as shown so far. In fact, this means that you will have less need for an additional indicator as the Ichimuko consists of more than elements to provide trading signals.
However, this does not exempt it from its limitations as the rest. We discuss some benefits and limitations of the Ichimoku Kinko Hyo indicator below.
Benefits of Using the Ichimoku Kinko Hyo Indicator
The Ichimoku Kinko Hyo indicator combines the work of major indicators at once, making it a diverse tool to use. Still, it can work alongside other indicators if a trader deems it pertinent. Some benefits of the Ichimoku Kinko Hyo indicator are listed below.
Pros
- As an all-in-one technical indicator, the Ichimoku Kinko Hyo indicator gives users a broad range of information in one chart. This includes price action, trend direction and trend strength, and potential support and resistance levels
- It provides clear entry and exit signals. The crossovers of its lines and breakouts of clouds are direct signals for making trading decisions
- It can be used on different timeframes. This makes it applicable to different kinds of traders, particularly day and swing traders
Limitations of the Ichimoku Kinko Hyo Indicator
The Ichimoku Kinko Hyo indicator is not wholly perfect. You may have to be more patient with analyzing the indicators’ charts compared to others. Some limitations of the Ichimoku Kinko Hyo indicator are as follows.
Cons
- The numerous lines of the chart can intimidate a trader at first glance
- In a rapidly changing market condition, the lagging nature of the indicator does not bode well for users, which can result in many delayed signals
- In a ranging market, the whipsaws of price action result in frequent crossovers of the indicator’s lines, many of which are false signals
Key Takeaways
- The Ichimoku Kinko Hyo indicator is a powerful tool that provides valuable insights into the market’s trend direction, possible entry and exit points, and overall market sentiment.
- The Ichimoku indicator consists of five elements (lines) – Tenkan-sen, Kijun-sen, Senkou-Span A and B, and Chikou span.
- Its line crossovers and cloud breakouts are reliable strategies for trade entry and exit.
- The Ichimoku indicator gives plenty of information at a glance, making it a very prolific indicator.
- Although additional indicators may not be necessary, it works well with others.
Frequently Asked Questions About Trading the Ichimoku Kinko Hyo Indicator
The following are some of the most frequently asked questions about the Ichimoku Kinko Hyo Indicator.
Can the Ichimoku indicator predict future price movements?
Like other indicators, the Ichimoku indicator cannot predict an asset’s future price movement with absolute certainty. Price movements are affected by myriads of conditions, including economic news, political news, economic data, and investor sentiments. That said, the Ichimoku indicator certainly serves as a guide, helping traders to make informed decisions; it is not a crystal ball for future predictions, but it can be an excellent tool to help you predict future price movements.
What is the best indicator to use with the Ichimoku indicator?
Your trading styles and preferences are the major determinants of what indicator to use with the Ichimoku Kinko Hyo. However, indicators that work well with it are the RSI for viewing overbought and oversold conditions and the MACD for measuring momentum. Experiment with different combinations to see which best suits you.
What are the best settings for the Ichimoku Kinko Hyo?
Conventionally, the default settings of the indicator work well with different assets and various timeframes. However, you can adjust the settings based on your preferences. Short-term traders can shorten the periods of the Tenkan-sen and Kijun-sen, while long-term traders can increase these periods.
Related Articles
How to use the Zig Zag Indicator – Trading Strategy and Tips
Risk Disclosure: The information provided in this article is not intended to give financial advice, recommend investments, guarantee profits, or shield you from losses. Our content is only for informational purposes and to help you understand the risks and complexity of these markets by providing objective analysis. Before trading, carefully consider your experience, financial goals, and risk tolerance. Trading involves significant potential for financial loss and isn't suitable for everyone.


