The moving average convergence divergence (MACD) is a popular technical indicator among analysts, day traders, and even long-term investors. It is a momentum indicator primarily used to gauge market sentiment and discover market trends.
Another use for the MACD indicator is the MACD divergence trading strategy. Like other divergences, the MACD divergence works on the principle that the indicator and the asset’s price must be correlated. If they are not moving in correlation, a divergence occurs.
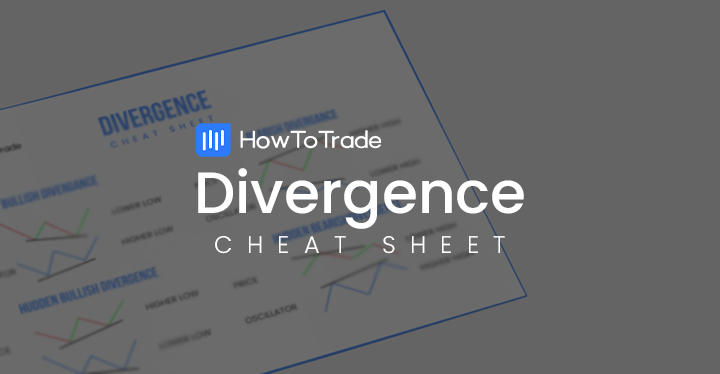
It is a powerful trading technique and one that any trader can easily utilize. So what do you need for that? A cheat sheet and understanding the concept of divergence trading. And this is what we are going to show you on this page.
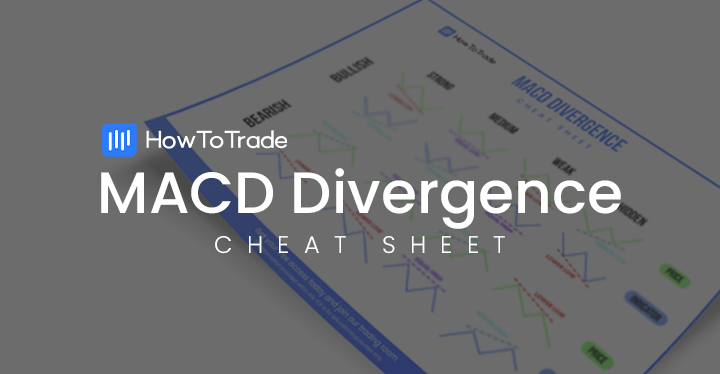
MACD Divergence Cheat Sheet Free PDF Download
To start, we suggest you download our MACD divergence PDF cheat sheet and use it at the beginning of your trading career.
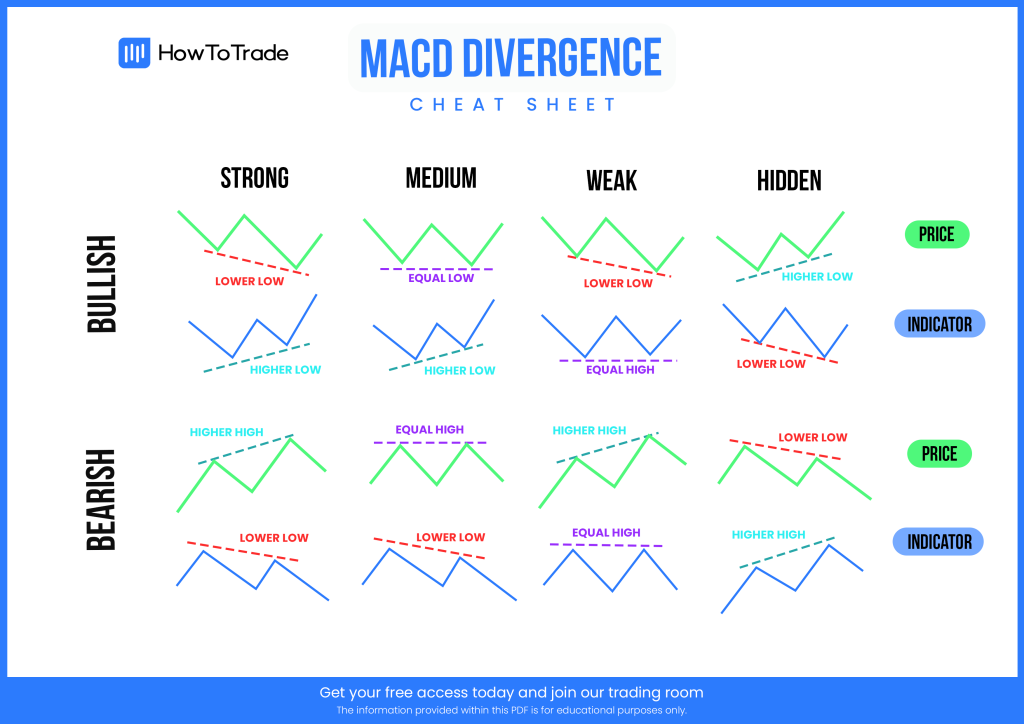
MACD Divergence Cheat Sheet PDF [Download]
What is the Moving Average Convergence Divergence Indicator?
The Moving Average Convergence Divergence, also known as MACD or MAC-D, is a momentum trading indicator that aims to identify changes in the trend momentum of financial assets. The MACD indicator is calculated by subtracting a long-term exponential moving average of 26 periods from a short-term exponential moving average of 12 periods.
Technically, the MACD is displayed as a sub-chart showing two trend lines – the MACD line, which is a blue line that represents the line of the 26 and 12 periods, and the signal line, which is a red line that represents a 9-period EMA. Additionally, the MACD has a histogram chart that shows the difference between the two lines. For example, this is what the MACD looks like on a crude oil price chart:
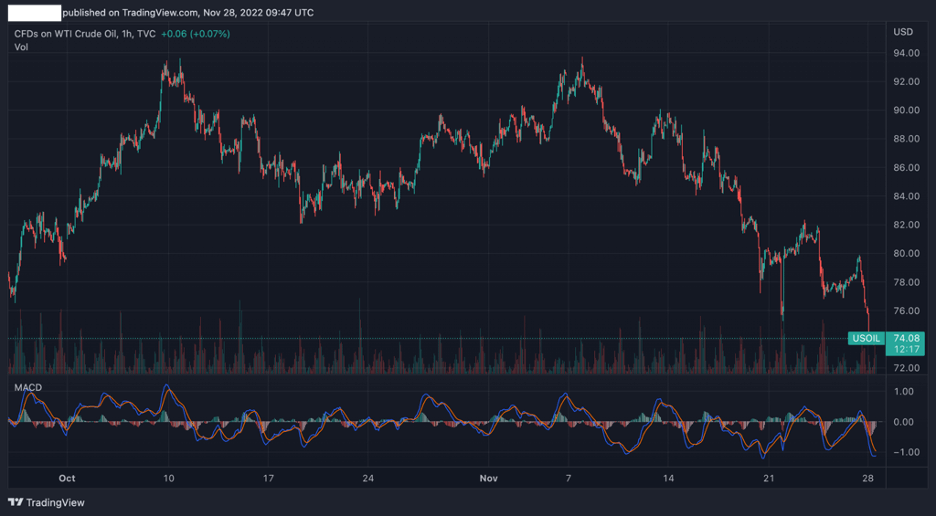
As you can see in the chart above, the MACD indicator is shown on a sub-chart with two lines and a histogram. Now, all things considered, the MACD is used to discover the strength of an existing trend. When traders notice a crossover of the two lines and a change in the histogram graph, a buy or sell signal is made.
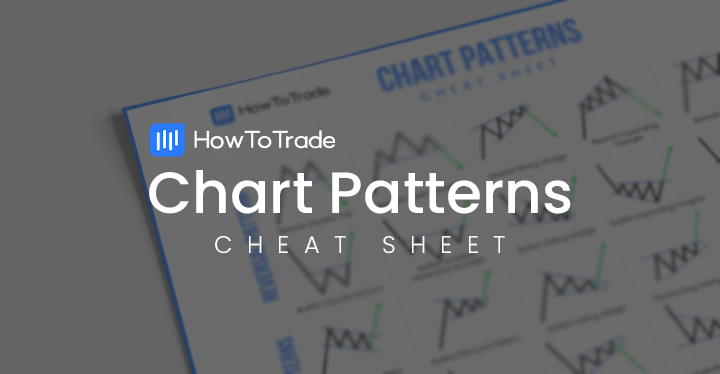
That said, the indicator by itself is typically not enough to trigger a buy or sell signal. Therefore, many traders use other tools to confirm the signal and ensure they find the best entry and exit levels. Such tools include:
- Chart patterns
- Fibonacci support and resistance levels
- Round numbers
- The integration of the level 2 order book
What is MACD Divergence?
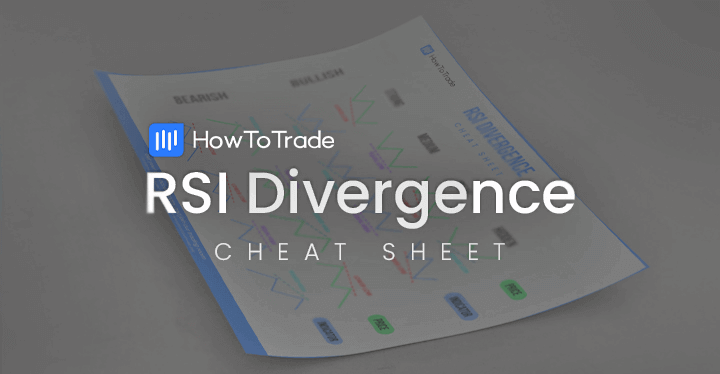
First, you need to understand the concept of divergence in trading. The simple explanation for that trading concept is a scenario that occurs in the markets when any momentum oscillator indicator and the asset price are not correlated, meaning they do not move in the same direction. Traders use various indicators to detect divergences, including the Relative Strength Index (RSI), the Stochastic Oscillator, and the MACD.
In principle, divergences work the same for any of the three indicators mentioned above. As for the MACD – When the price of an asset moves in one direction and the MACD’s indicator trend lines move in the other, that’s divergence. Divergence analysis is a great trading technique to identify a possible trend reversal or a pause in price action before the trend continues in the same direction.
The MACD works in both directions, which means there are bullish and bearish versions. They are also categorized into regular and hidden divergences. The difference between the two is that regular divergences signal that a trend reversal is likely to occur, while hidden divergences indicate that the existing trend is likely to pause before continuing in the previous direction. In short, a regular divergence provides a trend reversal signal, while a hidden divergence provides a trend continuation signal.
With that in mind, let’s explore each type of MACD divergence and how they are formed:
Bullish Divergence MACD
A regular bullish divergence MACD occurs when the indicator forms two higher lows while the asset’s price forms lower lows. A bullish signal is made when this formation appears on a trading chart, and a trader will enter a long buying position.
The hidden bullish divergence occurs when the MACD indicator forms lower lows while the asset’s price forms higher lows. This type of divergence signals that the existing trend will likely pause before the uptrend continues.
Bearish Divergence MACD
A regular bearish divergence MACD occurs when the indicator forms two lower highs while the asset’s price forms higher highs. When this happens, a bearish signal is made, and a trader will enter a short-selling position.
The hidden bearish divergence MACD appears when the MACD indicator shows higher highs while the asset’s price forms lower highs. In this case, it signals that the market is in consolidation or correction mode before the price downward trend continues.
Summary
Like any other type of divergence spotted on price charts, the MACD divergence is a handy tool for finding trading opportunities. However, it should be treated as something different than a forex trading strategy. Instead, you should use it as an extra confluence trading technique that will help you spot anomalies in the market and, thus, find profitable trades.
Luckily, there’s no rocket science in trading divergence. All you need to do is add the MACD indicator to your price chart, download our MACD divergence cheat sheet (as well as our divergence trading cheat sheet), and learn how to use each scenario to enter and exit trades. Additionally, before you apply this technique in live markets, you better backtest it on a demo account. That will certainly work for you until you learn how to naturally identify divergences without using a cheat sheet.
Risk Disclosure: The information provided in this article is not intended to give financial advice, recommend investments, guarantee profits, or shield you from losses. Our content is only for informational purposes and to help you understand the risks and complexity of these markets by providing objective analysis. Before trading, carefully consider your experience, financial goals, and risk tolerance. Trading involves significant potential for financial loss and isn't suitable for everyone.