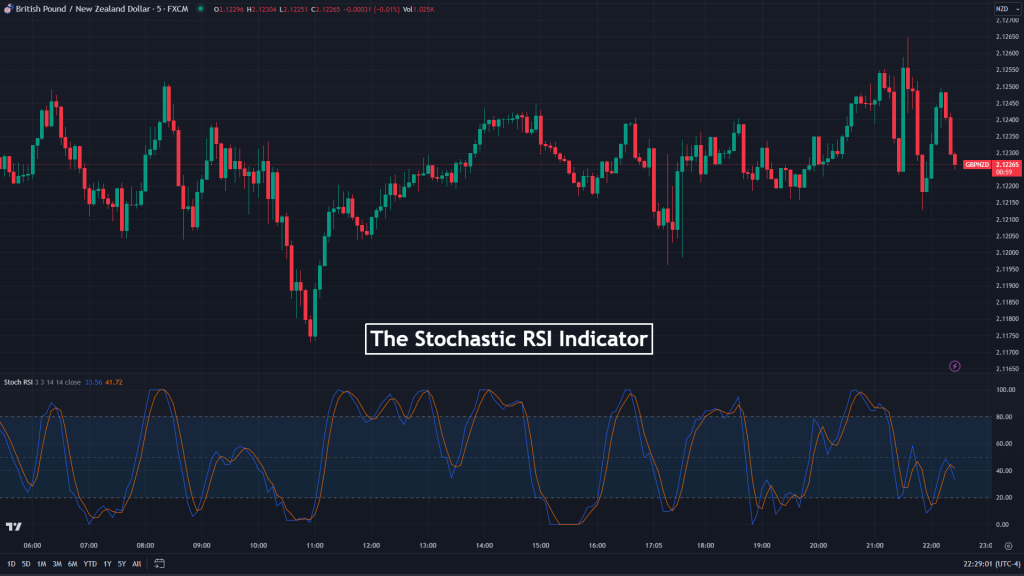
The Stochastic RSI indicator is an oscillator that measures the speed and momentum of price action by combining the attributes of a conventional Stochastic indicator and the Relative Strength Index (RSI) indicator. With this combination, the indicator seeks to generate a more sensitive measurement of price action momentum than the traditional RSI.
- The Stochastic RSI indicator is a powerful tool that combines the strength of the Stochastic oscillator and the RSI indicator.
- It offers traders unique perspectives on price momentum and potential turning points.
- By understanding overbought and oversold levels, and divergences, traders can incorporate these into a comprehensive trading strategy to make informed decisions.
In this piece, we explore the Stochastic RSI indicator, how it works, and how to apply it to your trading strategies. In addition, to help you decipher its efficiency in relation to other tools, we point out some of the indicator’s benefits and limitations that affect its usage. Without further ado, let’s dive right into it.
- What is the Stochastic RSI Indicator?
- How Does the Stochastic RSI Indicator Work?
- How to Use The Stochastic RSI Indicator in Trading?
- Stochastic RSI Indicator Trading Strategy Tutorial
- The Free Stochastic RSI Trading PDF
- Stochastic RSI Indicator – Pros and Cons
- Key Takeaways
- Frequently Asked Questions
What is the Stochastic RSI Indicator?
The Stochastic RSI indicator is an oscillator that measures the momentum of price movement, combining the characteristics of the traditional Stochastic Oscillator and the Relative Strength Index (RSI). Tushar S. Chande and Stanley Kroll first developed the indicator in 1994 and mentioned it in their book “The New Technical Trader,” published the same year. They aimed to provide a more refined view of overbought and oversold conditions and potential price reversals.
To further broaden our insight into the Stochastic RSI, let us examine the different components that make up the indicator- The stochastic Oscillator and the Relative Strength Index (RSI).
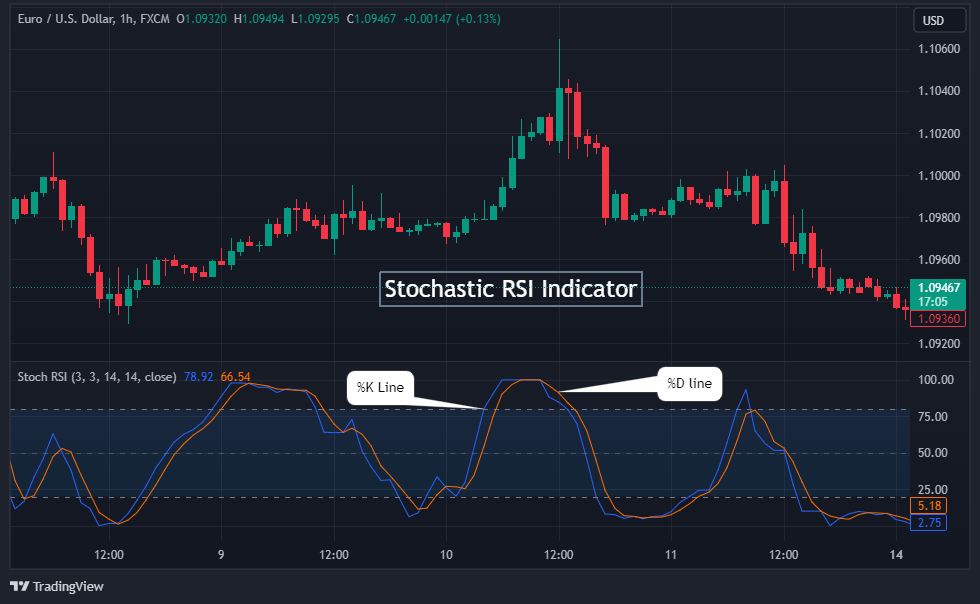
- The Stochastic Oscillator. This indicator measures an asset’s closing price in relation to its price range over a defined period. It has two lines, the faster-moving %K line, and the slower %D line. A cross between these two lines around the overbought and oversold conditions signals potential trade entry for users.
- The Relative Strength Index (RSI) measures the proportion of recent price changes to evaluate the speed and change of price movements. It ranges from 0 to 100, with readings above 70 indicating overbought conditions and readings of 30 and below suggesting oversold conditions.
Now, with these two technical indicators in mind, the Stochastic RSI indicator essentially applies the Stochastic Oscillator formula to the RSI values rather than the price data itself. The result of this combination is a more sensitive oscillator that assists traders in identifying potential turning points in the market with greater accuracy.
How Does the Stochastic RSI Indicator Work?
We will consider the formula that makes up the indicator and what its values imply.
To start with, as has been mentioned, it is pertinent to note that the StochRSI is based on traditional RSI readings. The number of periods the RSI uses is 14, and this value is considered for all the StochRSI evaluations. That said, you should calculate the Stochastic RSI in the following few steps.
- Record RSI values for the 14 periods considered
- Note the current, highest, and lowest RSI readings in the 14th period. You will need to input these values in the StochRSI formula.
- Repeat the previous step on the 15th period but only for the past 14 periods and evaluate the new StochRSI.
- By the end of each period, using only the last 14 periods, compute the new StochRSI.
Now, the formula for calculating the technical indicator is as follows.
StochRSI = (RSI – min RSI) / (max RSI – min RSI)
Where:
- RSI = Current RSI reading
- min RSI = Lowest RSI reading over the last lookback period. (14 in our example)
- max RSI = Highest RSI reading over the last lookback period.
With the new values derived, we get enormous insight into the market dynamics we can deploy to our trading strategies. We explore the implications of these values and what actions to take in the next section.
How to Use The Stochastic RSI Indicator in Trading
The StochRSI generates values that range from 0 to 100. However, the indicator’s overbought and oversold conditions are at the 80 and 20 levels, respectively. A value above the 80 mark indicates that the RSI is trading at the upper edge of the range, implying an impending exhaustion of the bullish momentum and a possible reversal into the bearish.
Traders begin to look out for a short trade entry in this case. Conversely, StochRSI values below 20 imply that RSI is trading at the lower edge of the range, and a potential bullish turn may set in, a signal for a long position.
In addition, you can use the StochRSI to confirm continuing short-term trends. The StochRSI oscillator moves between the 0 to 100 range, effectively crossing the 50 middle level in its course to either extreme. The “50” mid-level reinforces existing short-term trend direction such that a cross below this line indicates the market is bearish, and a cross above it signifies a bullish run.
Furthermore, the StochRSI helps you to identify divergences. Divergence occurs when the RSI and StochaticRSI indicators move in opposite directions. Bullish divergence, which is lower lows in price and higher lows in the indicator, signifies a potential upward reversal in trend. On the other hand, a bearish divergence, which is higher lows in price and lower lows in indicator, implies an imminent downward reversal in trend.
Finally, much like the Stochastic oscillator, you can watch for crossovers between the %D and %K lines. When the crossover occurs above the overbought threshold, it might be an opportunity to go short. When the indicator crosses below the oversold threshold, that could be an opportunity to go long.
Stochastic RSI Indicator Trading Strategy Tutorial
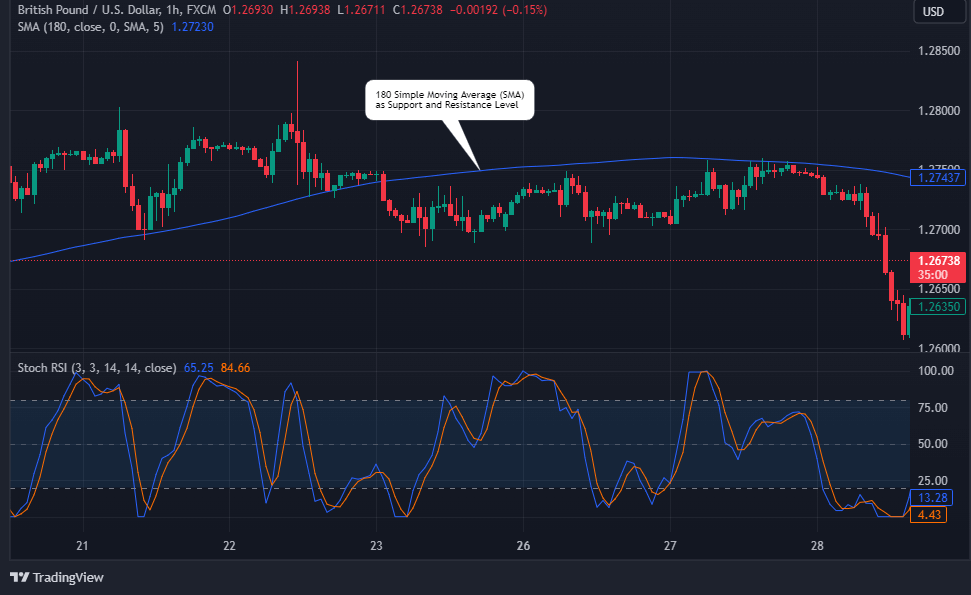
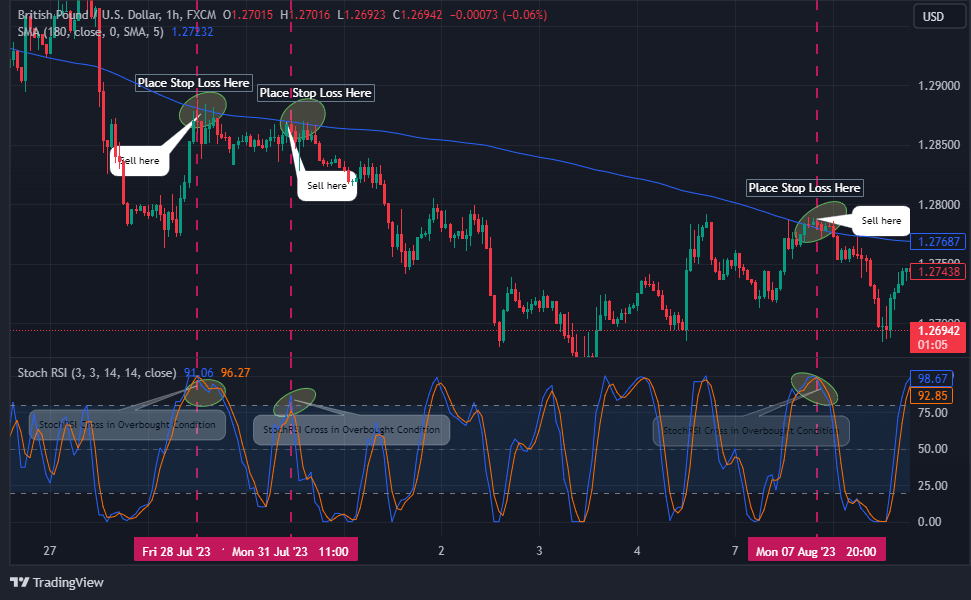
Now that you know how the Stochastic RSI indicator works and what its values mean, let us consider a step-by-step procedure for trading financial assets with the indicator. In this example, we consider the combination of the Stochastic RSI indicator with a 180 Simple Moving Average (SMA). The SMA serves as a major line of support or resistance for price movement while we look for a cross of the indicator.
Trading Strategy Setup
First, you need to launch your 180-period SMA onto your chat. However, note that you can alternatively use an Exponential Moving Average instead. Look out for what works best with your asset pair and timeframe. After that, pull up your Stochastic RSI indicator below the price chart.
The default settings for the StochRSI indicator are as follows. K= 3, D = 3, RSI = 14, and Stochastic Length= 14. These default settings work well for the 15-minute timeframe and above. You can also change the Stochastic Length setting to 8 for a smaller timeframe.
Entry Level
After your trade set-up, consider the following in getting into a trade.
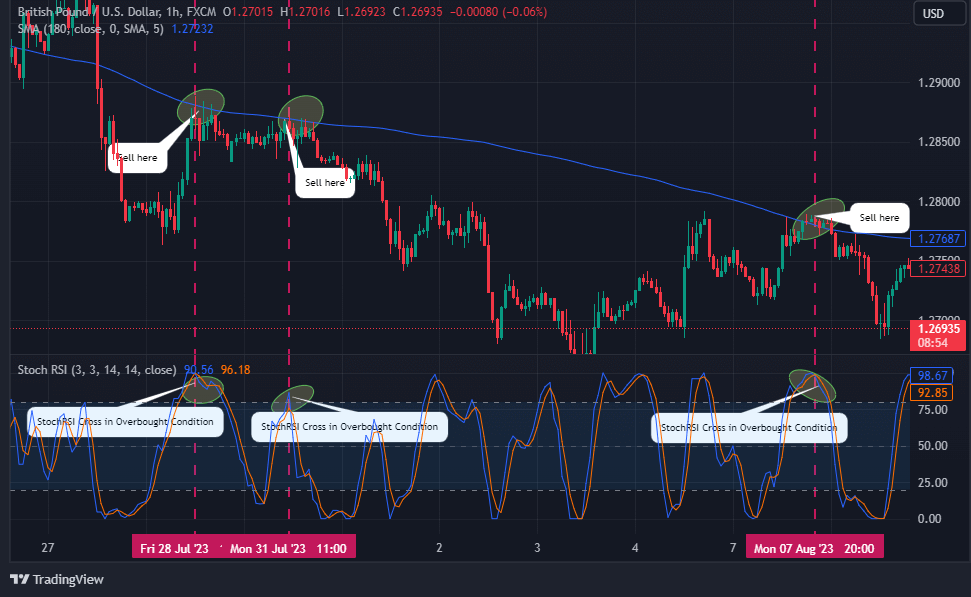
1. Identify a point where the 180 SMA makes resistance with price action in an overall downward trend.
2. Look out for a crossover of the indicator in the overbought region.
3. Enter a short position at the fulfillment of the two previous conditions.
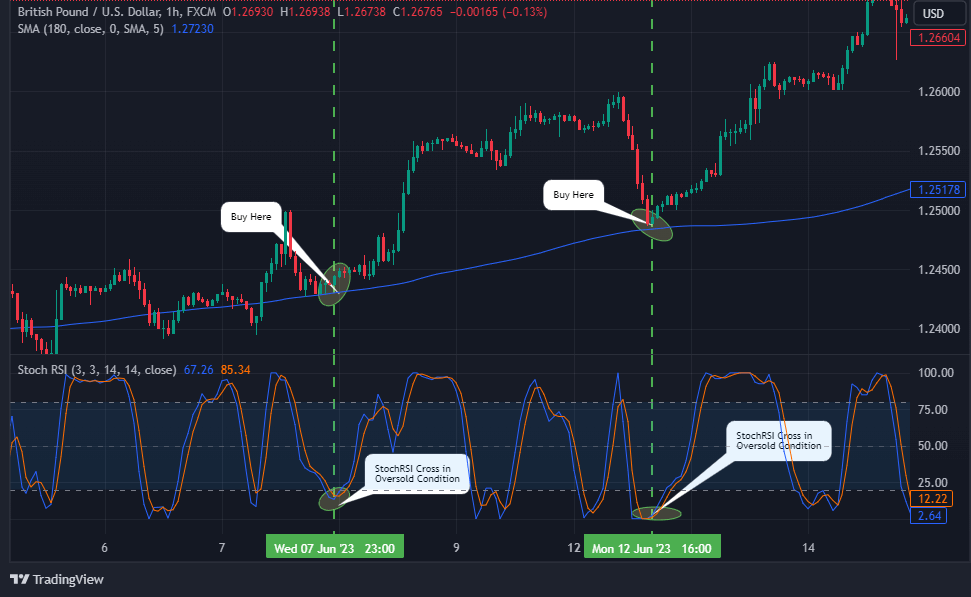
4. Otherwise, enter a buy position when SMA becomes the line of support for price action in an overall uptrend, and Stoch RSI crosses in the oversold region.
Stop Loss and Take Profit
Follow your standard risk management practice to set your stop loss, such as 50 pips away from the entry position. Alternatively, place your stop loss above the nearest high to your entry position.
Using a secondary indicator for your take-profit position is advisable, as using a StochRSI may throw you out of trades too early based on its sensitivity. Alternatively, use a trailing stop to follow your profit about 50 pips away to allow price action retracements.
What is the Best Setting for the Stochastic RSI Indicator?
The best setting for the Stochastic RSI indicator depends heavily on the kind of trader you are. At its default settings, the indicator has RSI and Stochastic periods of 14 each and K and D values of 3. While these default settings are good enough for most traders, there are slight adjustments you can make to make the indicator suit you a little better.
For instance, aggressive day traders can reduce the stochastic period setting to the 9 – 12 range. You can also adjust the K value to 1 or 2 for more sensitivity. However, if you’re a swing trader, you can raise the stochastic period to anywhere from 20 to 30, and the K value from 5 to 10.
However, know that the more sensitive the indicator is, the more prone it is to false signals. You may then need to use more indicators in conjunction with the Stoch RSI to clear out the false signals.
Having said all of this, we understand that all strategies are different. We’ve even found from experience that two people who claim to trade the same strategy often differ in their analyses, entries, or exits. And so, what works for you may not necessarily work for the other, so we highly recommend that you do your own backtesting. Find out what the Stochastic RSI setting works best for you and your strategy.
What are the Differences Between the Stochastic RS and the RSI?
The Relative Strength Index (RSI) measures the speed and change of price movements and helps traders determine whether an asset is overbought or oversold. The Stochastic RSI (StochRSI) attempts to refine the signals of the RSI by measuring how close the current value of the RSI is to the range’s high or low. The result is a more sensitive overbought and oversold signal. In essence, the StochRSI is an indicator of an indicator.
Another key difference between the RSI and the StochRSI is how each is used. The SI, being the less sensitive of the two, is used to confirm longer-term trends. The StochRSI, on the other hand, is liked by lower timeframe traders who are looking to take advantage of the slightest price movements.
If you’re wondering which to use, use the RSI if you want a simpler, cleaner view of momentum and are trading in a trending market. And use the StochRSI when you want quicker entries or scalping opportunities in sideways or volatile conditions. You can also combine them, with the StochRSI as your signal indicator and the RSI as your confirmation indicator.
The Free Stochastic RSI Trading PDF
If you need something to easily refer to when you’re trading, here’s a concise Stochastic RSI trading PDF. It’s free, by the way:
The Free Stochastic RSI Trading PDF
Stochastic RSI Indicator – Pros and Cons
The Stochastic RSI indicator serves a valuable purpose for quickly identifying price action reversals in the market. When you combine it with other relevant trading tools, you can quickly reinforce your trading sentiments. However, the complexity of its dynamics also portends a limitation for it. We discuss some benefits and limitations of this technical indicator as follows.
Benefits of Using the Stochastic RSI Indicator
The Stochastic RSI indicator is responsive and faster in churning out signals than its RSI counterpart. Combining it with a smoothed moving average helps finetune trade signals. Some benefits of the Stochastic RSI indicator are highlighted below.
Pros
- The sensitivity of the Stochastic RSI can provide early signals for potential trend reversals, enabling traders to get into trades ahead of the curve
- Its ability to identify divergence offers valuable confirmation for potential reversals or trend continuation
Limitations of the Stochastic RSI Indicator
The sensitivity and responsiveness of the Stochastic RSI indicator also pose some limitations to its effectiveness. Some of these limitations are highlighted below.
Cons
- The Stochastic RSI provides false signals in ranging markets. This is due to its significant responsiveness to little price changes
- Since the indicator is a second derivative of the price rather than the price itself, it sometimes goes off-sync with price action in real-time
Key Takeaways
- The Stochastic RSI is an indicator that analyzes the momentum of price movement by evaluating the RSI of price action rather than the price action itself. In other words, it is a second derivative of price action analysis.
- While the RSI indicator evaluates price range in relation to its close price for a specified period, the Stochastic RSI employs price values in a Stochastic formula to generate a more sensitive indicator.
- The Stochastic RSI indicator runs from 0 to 100 on major platforms. It has overbought and oversold levels of 80 and 20, respectively, and the lines move between these levels faster than the RSI indicator.
- The Stochastic RSI generates signals by a cross of its %K and %D lines.
- The Stochastic RSI is a helpful indicator for trading, albeit not without some limitations.
Frequently Asked Questions About Trading the Stochastic RSI Indicator
The following are some of the most frequently asked questions about the Stochastic RSI Indicator.
What does the Stochastic RSI indicator tell you?
The Stochastic RSI indicator provides insight into potential reversals and market momentum shifts. It helps traders identify overbought and oversold conditions more sensitively. It also reveals bullish or bearish divergences that signify potential shifts in the market.
Is the Stochastic RSI indicator better than the RSI?
Although both technical indicators use the same concept, one is simply a derivative of the other. While the Stochastic RSI offers quicker responses and enhanced sensitivity to price changes, the conventional RSI might be more suitable for specific strategies or traders who prefer a smoother indicator. Ultimately, the choice between them depends on your trading styles and objectives.
What are the best indicators to use with the Stochastic RSI?
The effectiveness of any combination of the Stochastic RSI and other indicators depends on your trading style and preferences. However, some indicators and tools that work well with the StochRSI are Moving Averages and the MACD. Other tools you can combine with the StochRSI include trendlines, trend channels, and support and resistance levels. These tools provide additional context to your trading decisions. Experiment with various combinations to find what works best for you.
Risk Disclosure: The information provided in this article is not intended to give financial advice, recommend investments, guarantee profits, or shield you from losses. Our content is only for informational purposes and to help you understand the risks and complexity of these markets by providing objective analysis. Before trading, carefully consider your experience, financial goals, and risk tolerance. Trading involves significant potential for financial loss and isn't suitable for everyone.