Trading divergences is a common strategy focusing on finding a miscorrelation between the asset’s price and a technical indicator. With this strategy, divergence traders are looking for price reversals or trend continuation signals to capture long price movements. And, if used properly, it can turn out to be a very rewarding and accurate way to find successful trades.
But to know how to trade divergences, you first need to understand how to identify divergence signals on trading charts. Is it complicated? Not really. Still, a cheat sheet can help you.
So, in this article, we provide our free divergence cheat sheet and help you understand what divergence is in trading, the different types of divergences, and how to identify divergences on a price chart.
Divergence Cheat Sheet PDF Download
Here, you can go with the quick divergence trading PDF cheat sheet, which will help you analyze the market using this trading strategy:
Divergence Cheat Sheet PDF [Download]
What is Divergence in Trading?
In a simple explanation, divergence trading refers to a trading strategy in which traders are explicitly looking for a mismatch between the price of the asset and a technical indicator. To utilize this strategy, they essentially try to find signals that the current trend may be weakening, which may lead to a pause of the existing trend and then – continuation or a trend reversal.
The idea of divergence in trading relies on the assumption that the asset’s price and the indicator should point in the same direction. When the opposite happens, the asset’s price and the indicator’s reading (usually stochastic oscillator, RSI, Commodity Channel Index, and the Moving Average Convergence Divergence) do not signal the same; a divergence occurs.
Generally speaking, the purpose of using strategy is primarily to get an early signal that the trend is losing momentum. When traders capture this anomaly or trend weakness in the markets, they interpret it as a mismatch between the current price and the asset’s true value. Then, based on the conditions in the market (bullish or bearish signal), they will enter a position to exploit this mismatch.
How to Identify Divergence in Trading?
At basic, in an uptrend, prices move in a formation of higher highs and higher lows. On the other hand, in downtrends, prices move in a series of lower lows and lower highs. Now, typically, technical indicators are usually correlated with the direction of the asset’s price.
But trading is all about finding the trade signals, and if there’s a mismatch between the two, you get a very reliable signal to enter a trade. So, to trade divergence, you need to use one of the suitable indicators to find these miscorrelations.
The most commonly used indicators for finding divergences include the Relative Strength Index (RSI) indicator, MACD, CCI, and most of all, the Stochastic Oscillator. All of these technical indicators are displayed in a sub-chart below the main chart, which helps traders easily identify a divergence when prices and indicators’ readings do not move in the same direction.
Once you notice the two are moving in the opposite direction, you’ll enter a position based on the rules and guidelines of each type of divergence. Yet, you must remember those divergences are not always accurate. As such, you need to use other tools to confirm the divergence is not a false signal. Some of these include:
- Chart patterns – Some patterns, like the bullish and bearish divergence patterns, will help you get the confirmation needed to enter a trader. Also, you can use other suitable chart patterns to confirm the trade, especially harmonic chart patterns that are extremely accurate in predicting price movements.
- Fibonacci Support and Resistance Levels – Another great technical analysis tool to confirm divergences is Fibonacci support and resistance levels. Using Fibonacci retracement levels will assist you in finding entry and exit when identifying divergences. If you are unfamiliar with Fibonacci retracement levels, we suggest you visit our guide on how to use the Fibonacci retracement tool.
- Wait for the candle to close – Finally, upon identifying divergences, you better wait for the divergence confirmation candle to close before entering a trade. No matter what time frame you are using, this will help you avoid false signals that frequently occur in the markets.
4 Types of Divergences in Trading
In general, divergences are categorized into two groups: regular and hidden divergences. Each group splits into two types of divergences: bullish and bearish. Crucially, the main difference between regular and hidden divergences is that hidden divergences usually signal the continuation of the existing trend, while regular divergences indicate a possible trend direction change.
All in all, there are four primary types of divergences:
- Regular Bullish Divergence
- Regular Bearish Divergence
- Hidden Bullish Divergence
- Hidden Bearish Divergence
Now, let’s explore each type of divergence in detail:
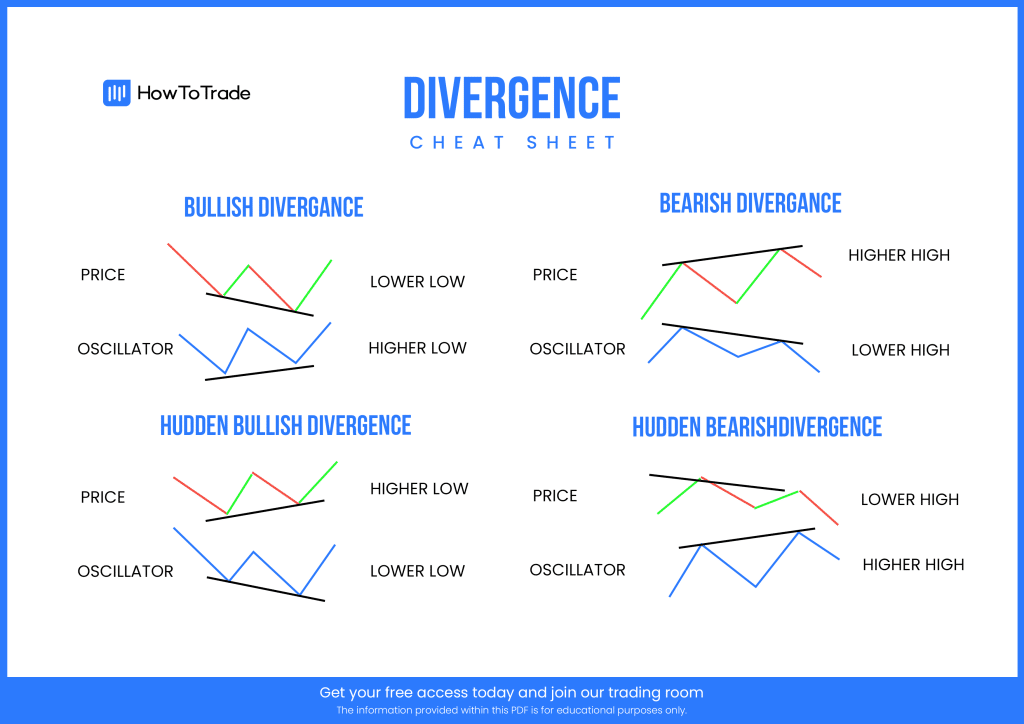
1. Regular Bullish Divergence
A regular bullish divergence occurs when there is a miscorrelation between an asset’s prices in a downward trend that makes lower lows and the technical indicator that makes higher lows. Traders interpret this phenomenon as a signal that the existing downtrend is losing momentum and a reversal is likely to occur.
2. Regular Bearish Divergence
A regular bearish divergence occurs when there is a miscorrelation between an asset’s price in an uptrend that makes higher highs and a technical indicator that makes lower highs. Opposite from the regular bullish divergence, traders interpret this occurrence as an early signal that the existing uptrend is losing momentum and a reversal is expected to occur.
3. Hidden Bullish Divergence
A hidden bullish divergence occurs when there is a miscorrelation between the asset’s price in an uptrend that makes higher lows and the indicator that makes lower lows. However, as we mentioned earlier, hidden divergences do not signal the likelihood of a trend reversal; instead, they point out that the market is likely to pause before continuing to trade in the same direction.
4. Hidden Bearish Divergence
The hidden bearish divergence occurs when there is a miscorrelation between the asset’s price in a downward direction that makes lower highs and the indicator that makes higher highs. Like the hidden bullish divergence, the bearish hidden divergence signals that the price is likely to pause before it continues to fall.
In sum, here’s a divergence table that can help you get the basic concept and meaning of each type of divergence with the Oscillator indicator:
| Divergence Type | Price | Oscillator | Signal |
| Regular Bearish Divergence | High -> Higher High | High -> Lower High | Bearish bias – Sell |
| Regular Bullish Divergence | Low -> Lower Low | Low -> Higher Low | Bullish bias – Buy |
| Hidden Bearish Divergence | High -> Lower High | High -> Higher High | Bearish bias – Sell |
| Hidden Bullish Divergence | Low -> Higher Low | Low -> Lower Low | Bullish bias – Buy |
Final Word
To sum up, divergence is a popular technical analysis tool that may provide many trading signals. The good thing is that understanding the divergence strategy is not very complicated – you need to know how to use specific technical indicators and compare them to the price action. Then, once you find a contradiction between the asset’s price and the indicator’s reading, you have a trade.
Beginners and advanced traders alike often find it difficult to remember the structure of each type of divergence. Lower highs, higher lows. Indeed, it isn’t easy to remember. For that reason, using a divergence cheat sheet is the ideal solution until finding divergences in the market comes naturally to you.
Risk Disclosure: The information provided in this article is not intended to give financial advice, recommend investments, guarantee profits, or shield you from losses. Our content is only for informational purposes and to help you understand the risks and complexity of these markets by providing objective analysis. Before trading, carefully consider your experience, financial goals, and risk tolerance. Trading involves significant potential for financial loss and isn't suitable for everyone.