The Aroon indicator measures the strength of trends and potential reversals in financial markets, providing traders with valuable insights into market direction and optimal entry or exit points. It can be used as a powerful tool to enhance trading strategies and decision-making.
- The Aroon indicator is a valuable tool for traders, offering insights into the strength of existing trends and the possibility of trend reversals.
- By analyzing the crossovers between the Aroon-Up and Aroon-Down lines, traders can gain timely indications of potential shifts in market direction, facilitating well-timed entries and exits.
- Extreme Aroon values, such as when both Aroon-Up and Aroon-Down reaching 100, signify the potential emergence of robust trends. Traders can use these extreme values to determine ideal entry and exit points in alignment with the prevailing trend’s strength.
In this guide, we will cover everything you need to know about the Aroon indicator, including how to use the indicator and implement the Aroon trading strategy.
What is the Aroon Indicator?
The Aroon indicator, a powerful technical analysis tool, was developed by Tushar Chande in 1995. The name “Aroon,” derived from the Sanskrit language, means “Dawn’s Early Light.” This name reflects the indicator’s core function – to shed light on emerging trends and potential reversals in asset prices.
The indicator is one of many momentum-based indicators that assess whether an asset is trending. It does this by measuring the time elapsed since the asset reached a high or low over a specified period.
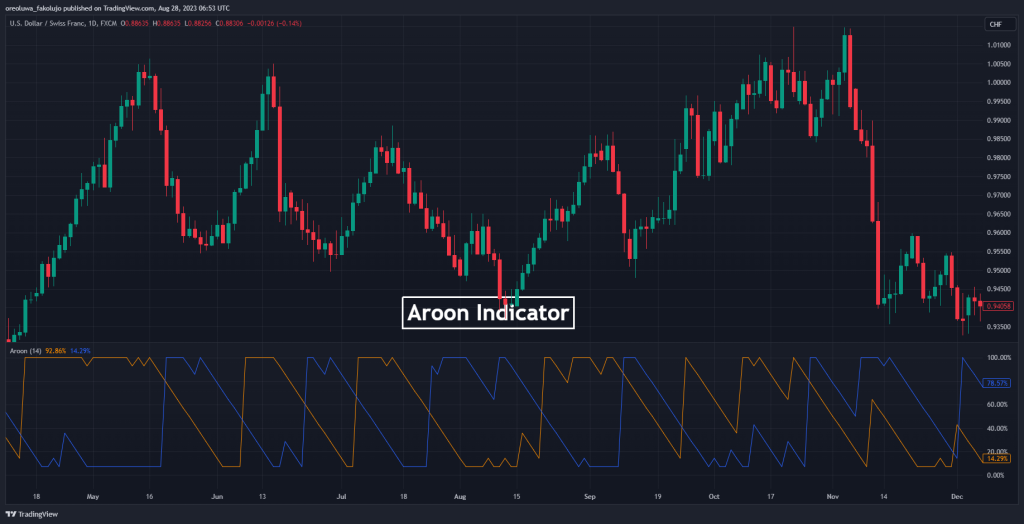
Here’s what the Aroon indicator looks like on a price chart:
How the Aroon Indicator Works
The indicator comprises two distinct components:
Aroon-Up Indicator: This component gauges the number of days since the asset recorded a 25-day high. It is expressed as a percentage and ranges from 0 to 100.
Aroon-Down Indicator: In contrast, the Aroon-Down indicator measures the number of days since the asset touched a 25-day low. Like the Aroon-Up, it’s also represented as a percentage between 0 and 100.
These two lines, Aroon-Up and Aroon-Down, are displayed side-by-side on a chart on a separate indicator window beneath your main chart, making it straightforward for traders to identify trends and potential reversals. It does this by finding crucial support and resistance levels, as well as supply and demand areas where the price might retrace or pause before continuing in the same direction.
When using the Aroon Indicator, there are a few key considerations to keep in mind to maximize its effectiveness. Firstly, it’s essential to select the appropriate chart for analysis. While the indicator is a robust tool, its suitability varies across different chart types.
Optimal results are often observed when the price of an asset is in a strong trend, indicating that the Aroon Indicator functions best in trending markets. The bulls are in a strong trend when the Aroon-Up is closest to 100. Likewise, the bears are in a strong trend when the Aroon-Down is closest to 100.
It’s also worth noting that the Aroon Indicator’s performance tends to wane when applied to ranging or consolidating markets. When the Aroon indicator lines move in the same direction, whether horizontally or with slight slopes, and are situated at similar levels, it often indicates that the market is consolidating. During these periods, the market lacks a clear trend direction, and price movement remains confined within a certain trading range.
As such, traders should exercise caution and consider supplementary analysis techniques during periods of price consolidation when utilizing the range trading strategy.
Suffice it to say, both Aroon indicators (Aroon-Up and Aroon-Down) are oscillators. In other words, they keep going up and down within a range. So, you can expect some traders to have some Aroon indicator strategies that have to do with divergences.
How to Calculate the Aroon Indicator Signal
You might be surprised at how straightforward it is to calculate the Aroon indicators. To do so, you’ll need the high and low prices of the asset over the given period, typically 25 days as the number of periods, as recommended by Tushar Chande.
We start by tracking the highest and lowest prices of the asset over the last 25 periods. Then, note the number of days that have elapsed since the asset reached its 25-day high and low. Finally, we plug these numbers into the Aroon-Up and Aroon-Down formulas:
Aroon-Up = ((25 – Days Since 25-day High) / 25) x 100
Aroon-Down = ((25 – Days Since 25-day Low) / 25) x 100
Following these straightforward calculations, traders can gain valuable insights into an asset’s trend strength and anticipate potential market reversals or consolidation periods.
How to Use the Aroon Indicator in Trading
There are three values to watch for when using the Aroon indicator: 0, 50, and 100. Here are the different methods to interpret each value:
Crossover – The first Aroon indicator signal is generated when there’s a crossover between the Aroon-Up and Aroon-Down. Simply put, when the Aroon-Up crosses above the Aroon-Down, the indicator signals that the market is likely to rise. Conversely, when the Aroon-Down crosses below the Aroon-Up, the indicator signals that the market is likely to fall.
The 50 Level – Another way to use the Aroon indicator is to look for the 50 level. When the Aroon-Up is above 50 and the Aroon-Down is below 50, then it means that the market is upward. When the Aroon-Up is above 50 and the Aroon-Down is below 50, then it means that the market is trending upward. On the other hand, when the Aroon-down value is above 50 and the Aroon-up value is below 50, then the market is trending downward.
The 70 to 100 and 0-30 Levels – Finally, the third signal comes when the Aroon-Up indicator reaches the 100 level, and the Aroon-Down reaches 0. These levels usually suggest a potential trend reversal. However, when the Aroon-Up indicator hovers around 70 to 100, the uptrend is likely to continue. Also, when the Aroon-Down indicator hovers around 0-30, the bearish trend is likely to continue.
Aroon Indicator Trading Strategy Example
In this section, we’ll guide you through a simple Aroon indicator strategy to make informed decisions when trading financial assets. In the example below, we’ll be showing you the Aroon crossover strategy.
Trade Entry
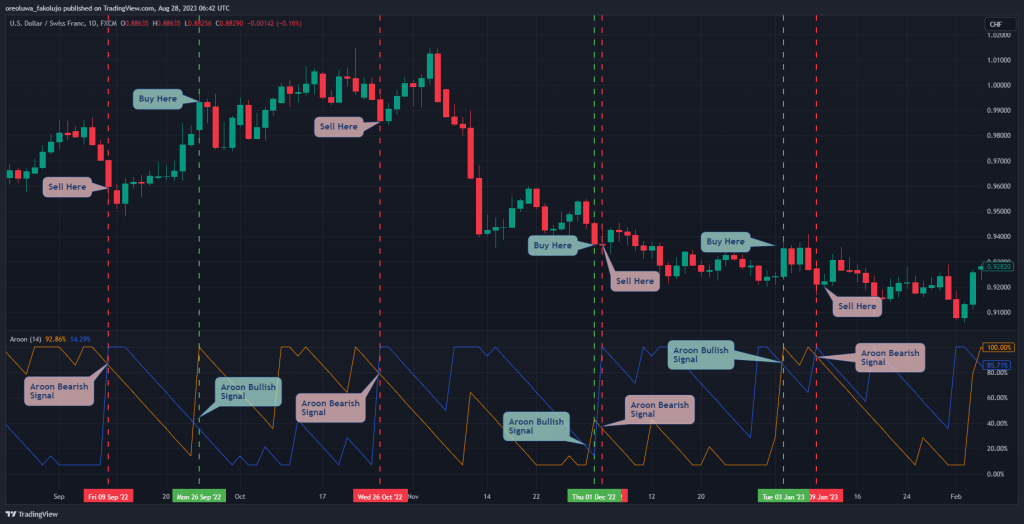
The crossover strategy with the Aroon indicator is quite simple and works similarly to other indicator crossover strategies like the Moving Average crossover technique. All you need to do is to spot areas where the Aroon-Up crosses the Aroon-Down to the upside.
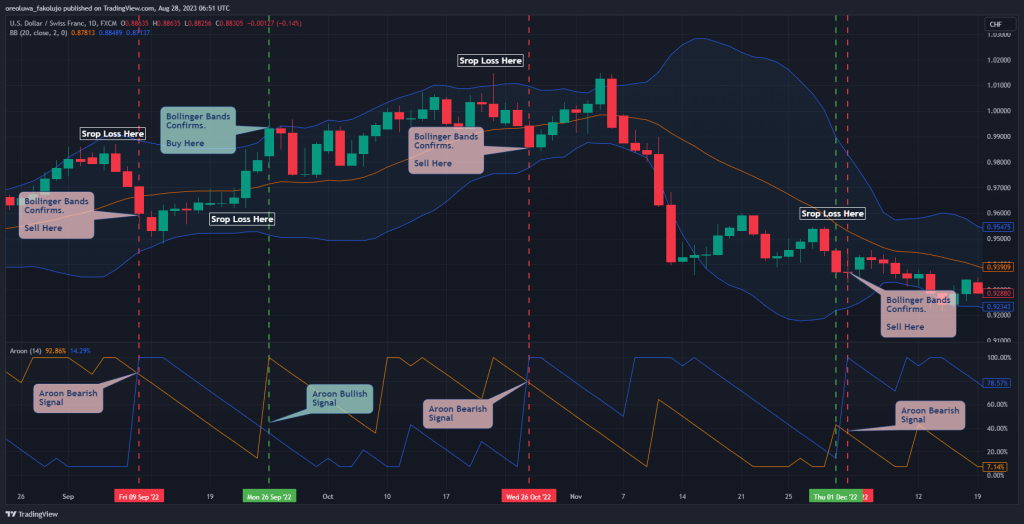
Those are your bullish signals. Then, your bearish signals appear when your Aroon-Down crosses over your Aroon-Up to the upside (as you can see in the USD/CHF daily chart below).
It is understandable that the Aroon indicator is prone to false signals. So, you can use other indicators or tools (such as trend lines, supports and resistances, etc.) as confirmation for your trade entry signals.
The Bollinger Bands indicator, for instance, is a great example of a confirmation tool. Confirmation on Bollinger Bands looks like this:
| Aroon Bullish Confirmation | The price crosses the midline of the Bollinger Bands to the upside |
| The price hits the upper Bollinger Band | |
| The price is in the upper half of the Bollinger Bands indicator. | |
| Aroon Bearish Confirmation | The price crosses the midline of the Bollinger Bands to the downside |
| The price hits the lower Bollinger Band | |
| The price is in the lower half of the Bollinger Bands indicator. | |
| No Trade Zones | The Bollinger Bands have a tiny width and are not sloped in any obvious direction. |
| The Aroon indicator signals don’t coincide with when the price is in any of the above positions on the Bollinger Bands indicator. | |
| Following the combination of the Aroon and the Bollinger Bands technical indicators, the image below shows what your trades would turn out to be. |
Following the combination of the Aroon and the Bollinger Bands technical indicators, the image below shows what your trades would turn out to be.

Stop Loss
Place your stop loss beneath the most recent high or low before the trade signal. So, if you are in a bullish trade, your stop loss level would be beneath the most recent swing low before your entry. And if your trade was bearish, your stop loss level would be above the most recent swing high before your entry.
Take Profit
The Aroon indicator can also be used as a take-profit tool, and the rules are simple: once again, you should use the crossover as a signal to exit a trade. So, exit bullish trades when the Aroon-Up falls below the Aroon-Down and exit bearish trades when the Aroon-Down falls below the Aroon-Up.
However, the Aroon indicator wouldn’t always get you out of trades at the best time. So, you may need to rely on other take-profit tools, such as risk-reward ratios, moving average crossovers, the ATR indicator, etc.
Benefits and Limitations of the Aroon Indicator
The Aroon Indicator, like any technical analysis tool, comes with its own set of benefits and limitations that traders should be aware of.
Benefits of Using the Aroon Indicator
One of the primary strengths of the Aroon oscillator is its ability to identify emerging trends. The crossovers between the Aroon indicators (Aroon-Up and Aroon-Down) lines can provide early signals of potential trend shifts, allowing traders to position themselves ahead of the curve. The Indicator also acts as an early warning system for possible price reversals.
By recognizing when the Aroon-Up or Aroon-Down line reaches extreme values, traders can anticipate changes in the market direction. Overall, the Aroon indicator is extremely useful in analyzing price action and finding trading opportunities.
In short, these are the potential benefits to enjoy from Aroon indicator trading strategies.
Pros
- It’s great for trend identification
- It offers an early warning system
- It also has a simple interpretation
- It works well when you combine it with other indicators
Limitations of the Aroon Indicator
Notably, the Aroon Indicator’s effectiveness can be diminished during periods of choppy market action. Rapid price fluctuations can lead to false signals, known as whipsaws, causing the Aroon lines to cross frequently without providing accurate direction.
There are also some instances when the Aroon Indicator generates valid trade signals, but by the time they appear, the market has already made a substantial move. Traders may find themselves entering positions just as the market is about to retrace, leading to missed opportunities or losses.
To avoid these scenarios, you should use other tools to confirm the signal, preferably a tool that will help you clearly identify support and resistance levels. Those include Fibonacci Retracement levels, chart patterns, and volume indicators.
These are some of the limitations users of Aroon indicator trading strategies may encounter:
Cons
- False signals in choppy markets
- Delayed signals
- It only reaches its best when it’s combined with other indicators.
Key Takeaways
- The Aroon indicator (or Aroon oscillator) proves to be a versatile instrument in trading, not limited to identifying trends but also offering insights into potential reversals. Traders can leverage its capabilities to make informed decisions regarding market direction.
- By observing the crossovers between Aroon-Up and Aroon-Down lines, traders can gain timely insights into potential trend shifts. When the Aroon-Up crosses above the Aroon-Down, it signals a possible uptrend, while the reverse indicates a potential downtrend.
- Extreme values in the Aroon Indicator, such as Aroon-Up reaching 70-100 or Aroon-Down reaching 0-30, serve as indicators of strong emerging trends.
- The 100 and 0 levels can also be used as areas where the price is likely to reverse.
- Despite its benefits, the Aroon Indicator faces limitations, particularly in choppy market conditions. Rapid price changes during such periods can cause frequent crossovers between the Aroon lines, leading to misleading signals and a whipsaw effect that can confuse traders.
Frequently Asked Questions About Trading the Aroon Indicator
The following are some of the most frequently asked questions about the Aroon Indicator.
What does the Aroon indicator tell you?
The Aroon indicator provides insights into the strength of a trend and potential reversals in a financial asset’s price. It consists of two lines – Aroon-Up and Aroon-Down – that help traders identify whether an asset is trending upward or downward. The crossovers and extreme values of these lines offer signals about possible changes in market direction, assisting traders in making informed decisions about when to enter or exit trades.
What is the best indicator to use with the Aroon indicator?
The best indicator to use alongside the Aroon indicator depends on the trader’s specific trading strategy and preferences. Popular complementary indicators include Moving Averages, Bollinger Bands, the Relative Strength Index (RSI), and MACD (Moving Average Convergence Divergence). These indicators can provide additional context to validate the signals generated by the Aroon indicator, enhancing the accuracy of trading decisions.
Can the Aroon Indicator be used as a standalone tool for trading decisions?
While the Aroon Indicator offers valuable insights, relying solely on it for trading decisions can have limitations. To enhance accuracy, traders are recommended to complement the Aroon Indicator with other technical indicators and a comprehensive price action analysis. This approach provides a more complete view of market trends.
Risk Disclosure: The information provided in this article is not intended to give financial advice, recommend investments, guarantee profits, or shield you from losses. Our content is only for informational purposes and to help you understand the risks and complexity of these markets by providing objective analysis. Before trading, carefully consider your experience, financial goals, and risk tolerance. Trading involves significant potential for financial loss and isn't suitable for everyone.