The Volume Weighted Moving Average (VWMA) indicator measures the mean of closing prices over a given period while considering volume data. It can be used to determine the average price of a traded security over a specific period and offer trading signals.
- The Volume Weighted Moving Average (VWMA) is an indicator that evaluates the ratio of an asset’s traded value to the sum volumes of transactions over a given period.
- It can help traders identify trends when combined with other moving average indicators.
- The VWMA is mostly used by intraday traders as the indicator normally gives more weight to periods with a higher trading volume.
- It should be backtested over multiple asset pairs before being used to predict future outcomes in a live trade.
In this article, you will find how to use and trade the VWMA indicator. We’ll help you find the strategies you can deploy and provide examples of how to use them. So, let us explore this indicator and discover what makes it unique.
- What is the Volume-Weighted Moving Average (VWMA) Indicator and How Does It Work?
- How Does the VWMA Work?
- Volume Weighted Moving Average (VWMA) Vs. Volume Weighted Average Price (VWAP)
- Volume Weighted Moving Average (VWMA) Vs. Exponential Moving Average (EMA)
- How to Use the VWMA Indicator in Trading?
- Volume-Weighted Moving Average Indicator Trading Strategy Tutorial
- Volume-Weighted Moving Average (VWMA) Indicator- Pros and Cons
- Key Takeaways
- Frequently Asked Questions
What is the Volume-Weighted Moving Average (VWMA) Indicator?
Moving averages are common indicators used in trading and for various reasons. Technically, a simple moving average uses price data to determine prevailing trends. As such, it can help traders better realize the overall market trend and mitigate the risk of unexpected price fluctuation. Also, they are straightforward to understand and use.
Here’s what a simple MA indicator looks like on a price chart:
However, one of the flaws of simple moving averages is that the indicator does not include trading volume data. And that is why the VWMA indicator is said to be more accurate. Volume Weighted Moving Average, on the other hand, adds volume data to its calculation. Similarly to the Chaikin Money Flow indicator, a VWMA is a technical analysis tool that combines the average security price data in a given period with the volume of trades in that period.
Many traders and analysts believe that volume data is essential in trading because it represents the number of units of an asset traded over specific periods. It also signifies the strength of activity and liquidity in the market. Therefore, a period with a higher volume will significantly influence the simple moving average value more than a period with a lower volume. That is the idea, for example, of the order blocks trading strategy.
How Does the VWMA Indicator Work?
Unlike a simple MA, the VWMA indicator evaluates its metrics by finding the ratio between the mean values of the closing prices of the specified period and the volumes traded. First, the asset’s closing price for each period is multiplied by the volume, and the sum is evaluated for the total number of periods being considered. This sum is then divided by the sum of the volumes in all the periods considered.
VWMA = Sum of (Closing Price * Volume) / Sum of Volumes.
Volume Weighted Moving Average (VWMA) Vs. Volume Weighted Average Price (VWAP)
The Volume Weighted Moving Average (VWMA) indicator is similar to the Volume Weighted Average Price (VWAP) indicator since they each consider volume data in displaying the moving average value. However, the main difference between the two indicators is that VWAP uses the average price obtainable in the period considered, hence, the high, low, and closing prices. In contrast, the VWMA uses the closing price only for the given period.
Therefore, many traders find the VWAP a more accurate indicator between the two, especially for short-term trading. The table below outlines the major differences between the VWAP and the VWMA.
| Feature | Volume Weighted Moving Average (VWMA) | Volume Weighted Average Price (VWAP) |
|---|---|---|
| Calculation Method | Weighted by volume traded | Weighted by volume traded and price |
| Primary Focus | Reflects average price influenced by trading volume | Indicates average price considering both volume and price |
| Signal Interpretation | Trend direction based on volume-weighted prices | Price level relative to VWAP |
| Volume Influence | Emphasizes periods with higher trading volume | Reflects the average price influenced by trading volume |
| Application | Identifying price levels influenced by volume | Gauging buying/selling pressure within a trading session |
Volume Weighted Moving Average (VWMA) Vs. Exponential Moving Average (EMA)
The EMA is another moving average indicator. However, it prints its line differently from the VWMA. The significant difference between them is the consideration of volume in the calculation.
The Volume Weighted Moving Average (VWMA) considers both price and volume. It gives more weight to price movements that occur with higher trading volume. The Exponential Moving Average (EMA), on the other hand, focuses solely on price, but applies more weight to the most recent prices.
| Feature | Volume Weighted Moving Average (VWMA) | Exponential Moving Average (EMA) |
|---|---|---|
| Calculation Method | Weighted by volume traded | Weighted by recent price |
| Primary Focus | Reflects average price influenced by trading volume | Focuses on average price with emphasis on recent prices to give more price-sensitive signals |
| Sensitivity | Sensitive to both price and volume changes. | Sensitive to price changes, especially recent ones. |
| Best Suited For | Markets where volume is a key indicator (e.g., stocks, forex). | Reflects the average price influenced by trading volume |
| Application | Identifies trends with volume confirmation; useful in volatile markets. | Tracks price trends; useful for short-term trading signals. |
How to Use the VWMA Indicator in Trading?
Generally, the VWMA is used the same way as the moving average or exponential moving average indicators. The indicator is displayed as a line on the main price chart, and much like the SMA, traders use crossovers to enter and exit trades.
The VWMA line moves more closely with price action than the Smoothed Moving Average (SMMA) on the chart. This makes it better reflect the market dynamics, especially regarding volume. When combined with chart patterns and other indicators, such as the SMMA, it brings plenty of insight.
Crossovers between the indicator’s line and the asset’s price typically provide a trading signal. Once the indicator crosses above the price, a bullish signal is made. On the other hand, when the VWMA crosses below the price, a sell signal is given.
Moreover, a crossover between the indicator and other indicators can mean different things to help a trader make informed decisions. It can also help identify range breakouts that tell a trader to place a buy or sell order. These concepts will be extensively looked into in the following section.
Volume-Weighted Moving Average Indicator Trading Strategy
Now that you have an overview of the VWMA indicator and its workings, let us dig deep into how to use some volume-weighted moving average trading strategies. Our focus will be primarily on the TradingView platform, but the same applies to most other platforms.
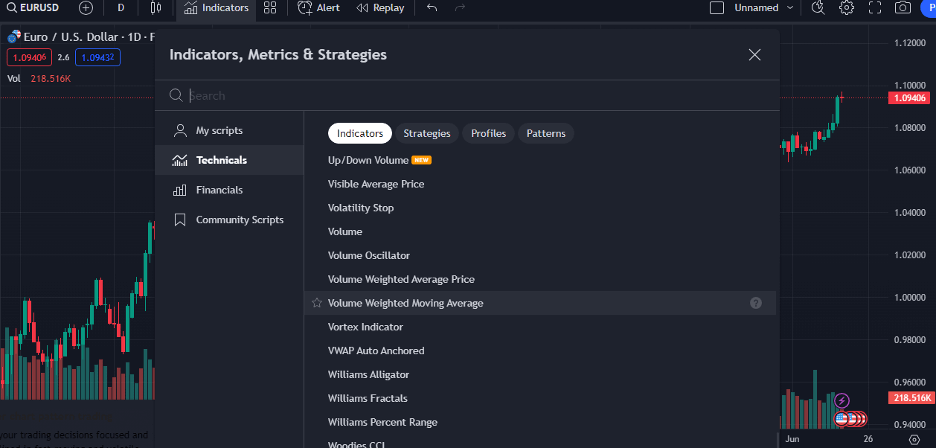
Step 1: Add the Indicator
The VWMA indicator is accessible on popular trading platforms such as TradingView and MT4/MT5. Once you are set on a trading pair chart on TradingView, click the “Indicators” tab and scroll down the “Indicators, Metrics, and Strategies” tab to find the VWMA. Click to launch it directly on the existing chart. The indicator will then be displayed as a line graph running in tandem with price action.
Step 2: Find Buy and Sell Crossover Signals and Enter a Trade
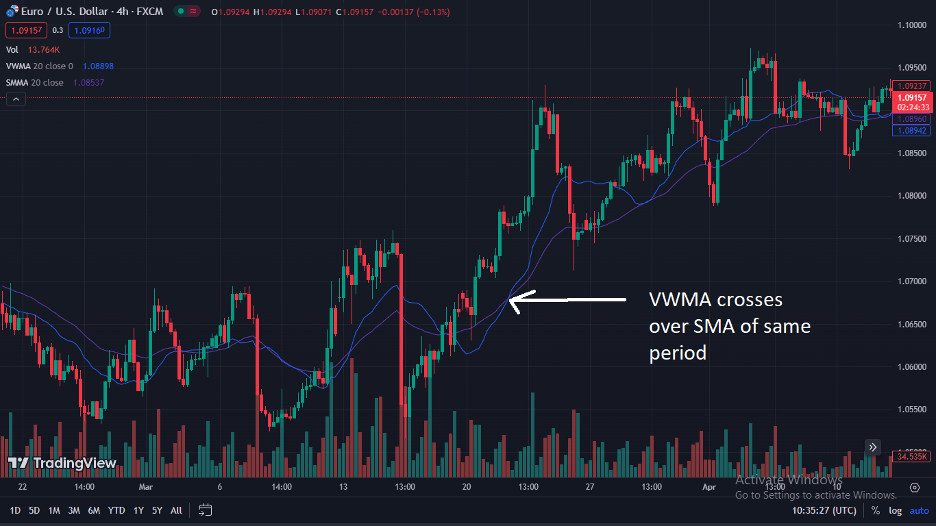
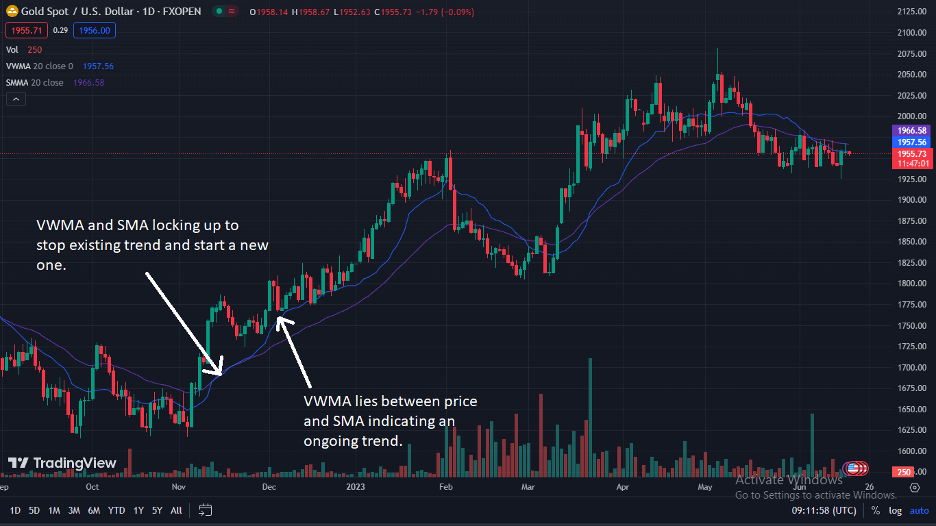
The VWMA is best combined with another moving average indicator, such as the Smoothed Moving Average (SMMA). To utilize this volume moving average strategy, the two indicators should be set to the same period to give a good perspective. With this, the VWMA can be shown to help identify a bullish or bearish trend just before it starts.
After launching both indicators on your chart, an appearance of the VWMA (in blue) below the SMMA (in purple) shows a strengthening of market activities for the bulls. However, when the VWMA crosses over and above the SMMA, this shows a change in market trends that are about to favor the bears.
When a crossover between the two indicators takes place with the VWMA below the SMMA while price action is going up, that shows that a bullish trend is about to emerge, and a long position can be taken. Conversely, when price action falls below both moving averages, and the VWMA makes a crossover right back above the SMMA, it indicates that a bearish run may soon start and a short position can be taken.
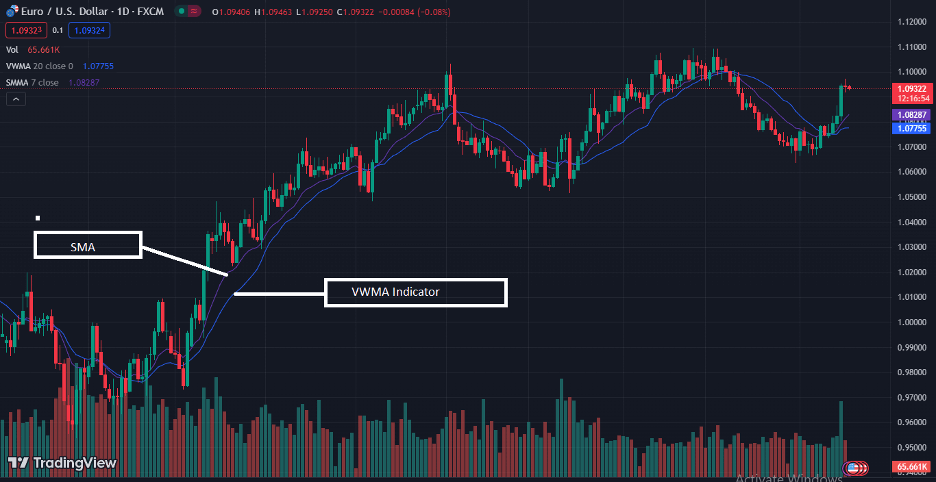
As you can see in the chart above, the market trend changes every time a crossover between the VWMA and SMA occurs.
Furthermore, existing trends can also be identified with the indicator. This can help you to jump right into the trend while it lasts. The basic rule here is that the VWMA will mostly lie between the price action and the SMMA in the direction of the trend. It is possible to see the VWMA line testing the SMMA line or occasionally making breakouts, but the trend remains the same.
However, when the two moving averages begin to swirl around each other for extended periods, that indicates that the trend is ending, and a reversal is likely to occur.
Step 3: Place Stop Loss and Take Profit Target
Now, you are in a trade and looking for price levels to place your stop loss and take profit targets. For that purpose, there are several ways to do so.
Generally, in a trending market, the VWMA can be used for trailing stops when the price hits and crosses the indicator’s line. The VWMA is considered by many traders a natural line of support and resistance for the price action. It is, therefore, a good idea to place your stop loss a few pips beyond the indicator’s lines at the start of the trade position and trail it for as long as possible.
Another technique to find stop loss and take profit take target is by using Fibonacci support and resistance levels. With this technique, you draw a Fibonacci retracement level from the highest to the lowest level of the previous price swing. Then, you can place SL and TP at the closest level to your entry price level.
What are the Benefits and Limitations of the Volume-Weighted Moving Average (VWMA) Indicator?
As discussed, the VWMA is a good indicator for making informed trading decisions when combined with other indicators and analyses. However, it does have its limitations as well. So, let’s review some of the benefits and limitations of this indicator.
Benefits of using the VWMA indicator
Pros
- Since volume data is considered, the VWMA indicator gives a more insightful perspective of market activities and dynamics
- It is easy to read, use and interpret
- It is compatible with many other indicators, helping to raise the potential of making well-informed trading decisions
Limitations of the VWMA Indicator
Cons
- As obtainable in many moving average indicators, the VWMA is a lagging indicator. This implies that the values displayed only change after the price of the traded assets changes. This can cause a trader to decide later than necessary
- The indicator also makes considerable changes in the pattern when there are unprecedented changes in market activities, making it somewhat difficult to interpret
- As it uses closing prices only, the indicator is also prone to missing important data points that could have helped a trader take well-informed long and short positions
Key Takeaways
- The Volume Weighted Moving Average indicator is a technical analysis tool incorporating the average price and volume data in its reading, giving a unique view of the market momentum and dynamics.
- The indicator can identify the start of a new trend, confirm existing ones, and pick out trend reversals. It is also used as trending support and resistance for trailing stops in a trend.
- When combined with other indicators and technical analysis like SMA, the VWMA can serve as an accurate and reliable technical analysis indicator.
Frequently Asked Questions About the VWMA Indicator
The following are some of the most frequently asked questions about the VWMA indicator:
Do Pro Traders use the VWMA Indicator?
Professional traders look out for a combination of volume and price to maximize profit. The VWMA indicator is a great tool that combines these two features. It is, therefore, one of the go-to indicators for professional traders.
How Accurate is the VWMA Indicator?
The VWMA indicator is more accurate than other moving average indicators that do not consider volume data. Since volume indicates the level of activity and momentum of a market, it is a valuable factor in predicting future outcomes of price action.
What are the Alternatives to the VWMA Indicator?
The Volume Weighted Average Price (VMAP) indicator is an alternative to the VWMA. While VWMA uses the closing price of every trading period to evaluate its data, VMAP simply uses the mean price level in the given period.
Risk Disclosure: The information provided in this article is not intended to give financial advice, recommend investments, guarantee profits, or shield you from losses. Our content is only for informational purposes and to help you understand the risks and complexity of these markets by providing objective analysis. Before trading, carefully consider your experience, financial goals, and risk tolerance. Trading involves significant potential for financial loss and isn't suitable for everyone.