The Zigzag Indicator is renowned for cleaning out unavoidable market noises and filtering smaller price movements. As it eliminates random price fluctuations, it is used by traders for objectively identifying price trend reversals and can help them find trading signals.
- The Zig-zag is an indicator that cancels out the many little upward and downward changes in price action and portrays them as cleaner and fewer series of major uptrends or downtrends based on the trader’s setup.
- It does this by identifying points of trend reversals (swing high and swing low) that match the specific percentage settings of the trader.
- The percentage is a fraction that depicts how much the price moves from a previously marked point.
- The Zig-zag indicator helps identify new market trends and reversals.
- It is an indicator that should be relied on only in combination with other financial tools and technical analyses.
In this piece, we discuss everything you need to know before getting on the Zig-zag indicator, possible ways to use it, and the strengths and limitations associated with the tool. Now let’s get into unraveling this helpful indicator.
What is the Zigzag Indicator?
Imagine that different traders were asked to draw out trend lines on a specific chart of the same asset pairs and the same timeframe provided to them. There is a considerable likelihood that each trader would come up with slightly different lines on the charts based on their unique perspectives of the same market. Then the question is, whose lines are the perfect ones? Here is where the Zigzag indicator comes in.
The Zigzag indicator maps out a series of unique trendlines on a chart based on a percentage price deviation. Unlike similar indicators, the Zigzag indicator always stays the same, clearing out any subjective bias from traders and filtering minor price movements.
It does this by identifying a starting point on the chart (a swing low or swing high) and plots a straight Zig zag line in the direction of the trend to another point where a predetermined percentage reverses price action. Else, the trendline continues to extend in the existing direction. And that is how the Zig zag indicator works – it basically helps traders identify price trends.

How Does the Zigzag Indicator Work?
Technically, the indicator calculates and draws its charts in the following few steps:
- The trader selects a swing low or swing high (in this example, a swing low) as a reference point.
- The trader also determines the percentage movement for which the indicator applies its calculation.
- The indicator identifies a new point (swing high now) after the percentage price movement is fulfilled or exceeded. If the percentage is not attained while a pullback in price action takes place, the indicator continues to search for the swing high.
- Once the previous condition is fulfilled, a new line is drawn to the new point, and a reversal trend line begins.
- The process is repeated until the final or current price level.
When all these steps are completed, the Zig zag indicator lowers any random price fluctuations and can reveal reversal patterns.
The indicator can be accessed on trading platforms like TradingView and MetaTrader4. Specifically for MT4, it is available for download and can be installed on your trading platform if unavailable. When launched, it is displayed directly on the main chart of the asset pair traded.
How to Use The Zigzag Indicator in Trading?
The Zigzag indicator has a price deviation parameter in percentage that can be altered based on the market’s volatility and the chart’s time frame. A smaller value of price deviation will result in more conspicuous zig-zag lines drawn on the chart. The straight lines of the chart form major uptrends and downtrends in the market as calculated by the indicator.
So, how does it benefit your trading? How can you use the indicator to identify areas where prices reverse? The primary technique to use this indicator is to predict future trends, and this is what we will show you below.
Trend Identification
One thing the ZigZag indicator does well is that it helps to identify trends. This feature makes it a great tool for spotting and trading most price action strategies, especially those that can be hard to spot.
For instance, you can spot market structure with it. This way, you can catch swing highs and lows. You can also spot price channels more easily. You can even use it with chart patterns, such as Elliott Wave, Head and Shoulders, and more. In short, the indicator makes trends easier to identify.
It is important to note, though, that the Zig Zag feature is a lagging indicator, so it can hardly be used to make trade entries in isolation. But once you combine it with the tools we already mentioned, it transforms into an unexpendable trend trading indicator.
Zigzag Indicator Trading Strategy Tutorial
The Zigzag indicator may be used to enter trades, place stop loss, and take profit targets. However, the information for placing such trades may be inadequate since the indicator lags and can alter a new line drawn at any point as the market dynamic changes.
Therefore, using it with other indicators and tools like Fibonacci retracements, and oscillators becomes crucial. Now, let’s see an example of how you trade using the Zigzag indicator.
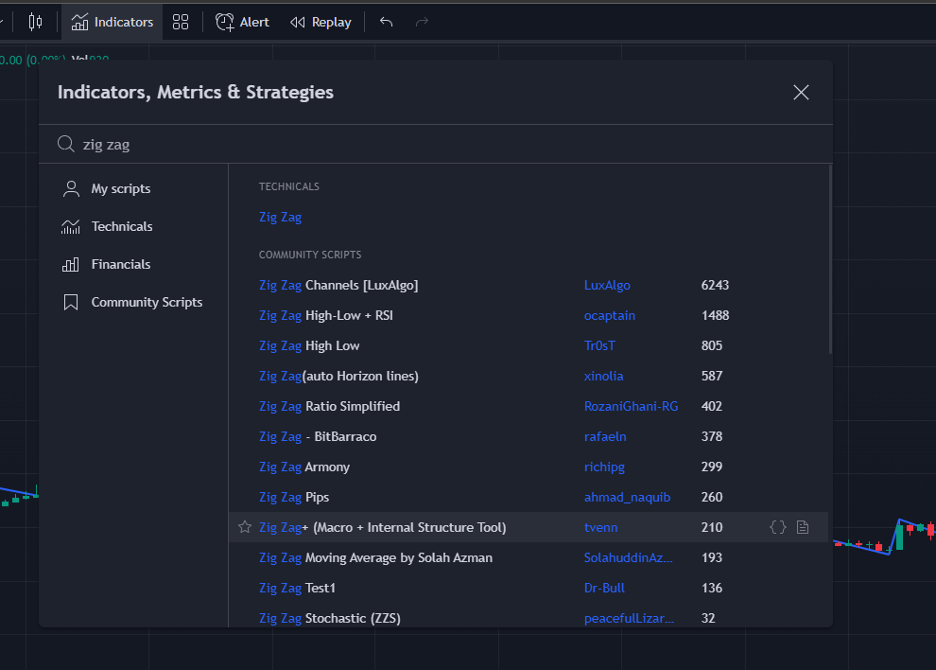
Step 1: Add the Indicator
The first thing you need to do is to add the indicator. Here, we will show you the process of adding the Zig zag indicator on TradingView; however, the process is pretty much the same on any other trading platform where the indicator is available.
So, to do that, click on the “Indicators” tab on top of the main chart of your TraderView. Search for “Zig Zag” in the search box that follows, and choose the first one that pops up.
If you are an MT4 user, click the indicators tab and scroll down the list of indicators to locate the Zigzag Indicator, and click to launch it onto your main chart after applying your custom settings.
Step 2: Find Buy and Sell Signals and Enter a Trade
As mentioned, the best approach for using the Zigzag indicator is in combination with other tools. But here, we’ll be using it to identify price channels. It is an excellent strategy to use with the Zig zag indicator as it enables you to clearly see areas where prices might reverse.
Once you have identified a trending channel, you can buy and sell inside a range, hence, implement the range trading strategy. To utilize this strategy, you should take the following steps:
- Add the zigzag indicator to your chart. Then, tweak the deviation until the lines follow the chart more closely.
- Once you see a channel form, buy at the bottom of the channel and sell at the top of the channel.

Remember that the Zig Zag shines best when used with other tools. It doesn’t do much on its own beyond helping you point at the price movements. For instance, you can use other momentum indicators, such as the RSI, MACD, and Momentum Oscillator, to confirm the Zigzag trading signals.
Step 3: Place a Stop Loss and Take Profit Target
With the collaboration of other indicators, the Zigzag indicator can also be used to set stop loss levels and take profit targets based on support and resistance levels and other considerations.
For instance, with the price channel example, you can set your stop loss a few pips above your bearish entry position or a few pips below your bullish entry position.
That said, you must remember that for the most part, your stop loss and take profit levels won’t depend on the indicator itself. Rather, they will depend on the other tools you combine the indicator with.
What are the Benefits and Limitations of the Zigzag Indicator?
As shown so far, the Zigzag indicator does quite well in clearing market noises and gives a clearer perspective of the market trend dynamics. It also has some limitations that sometimes render it solely undependable. In this section, we mention these benefits and limitations, so you can know ahead of time how to use the indicator correctly.
Benefits of Using the Zigzag Indicator
The Zigzag indicator is unique in translating “busy” charts into simple trendlines on which more in-depth analysis can be done. Its ability to simplify charts cannot be undermined. This crucial attribute makes it derive some of its merits highlighted below.
Above all, the Zigzag is perfect for trend identification. Newbie price action traders will find this very useful, as most price action strategies are hinged on recognizing trends. Also, the fact that it can smoothen out the noise on the market trends makes it convenient and easy to use.
In sum, here are the key points that make the Zig zag indicator an effective trading tool.
Pros
- Tiny price movements can look chaotic on charts, giving a trader too much to deal with when analyzing. The Zigzag indicator clears that out and offers a cleaner slate
- The Zigzag indicator is also adaptable to various timeframes, and the parameters only need to be adjusted to suit the desired timeframe
- The indicator is effective at giving trade opportunities when used with other relevant indicators or technical analysis tools
Limitations of the Zigzag Indicator
No single indicator holds the title of being the holy grail for trading assets. The Zigzag indicator is the same. Clearly, greater care should be taken when using this indicator because it offers the most basic solution to analyzing your charts.
One critical issue of using the Zig zag indicator is its ability to be adaptive to price changes. Often, when the asset’s price changes direction, the indicator immediately starts a new line. However, if the line fails to reach the indicator’s default settings, an extended zig-zag line in the previous trend direction is formed. This can create false signals and should be carefully examined by traders.
Some of the limitations of the Zigzag indicator are as follows.
Cons
- It is a lagging indicator, which means price action changes before the indicators chart changes, opening a window for false or missed signals
- A new trend line will be redrawn if price action takes a different turn from the one being previously drawn. This can sometimes give misleading information
Key Takeaways
- The Zigzag indicator is a basic tool that significantly eliminates market noises and produces clear swing highs and lows of price action.
- It is an excellent indicator for identifying major market trends, particularly when used in combination with technical indicators.
- The indicator’s parameters can be adjusted to suit the timeframe being analyzed.
- The Zigzag indicator has limitations and should be used cautiously, especially as a stand-alone indicator.
Frequently Asked Questions About the Zigzag Indicator
The following are some of the most frequently asked questions about the Zigzag Indicator.
What is the best time frame for the Zig Zag indicator?
Many recommend that you use the Zig Zag in the 1-hour timeframe. While they have their genuine reasons, we believe the best timeframe for the Zig Zag indicator is the one you’re most comfortable trading in.
Crucially, the 1hr timeframe may be too fast-paced for swing traders who are there for the long term. Scalpers and intraday traders may also see the 1-hour timeframe as being too slow. If you belong to any of those categories, you should use the Zig Zag on your preferred time frame and tweak it until you have something that works with your strategy. The best method is to try different time frames until you find the one-time frame that works best for you.
How do you read the Zig Zag indicator on a price chart?
The Zig Zag indicator is very easy to read on the price chart. You simply check the direction of the last line, or price swing. If it goes up until it hits the most recent swing high, then you’re likely in an uptrend. Conversely, if it goes down until it hits the most recent swing low, then you’re likely in a downtrend.
However, the indicator lags. So, it is almost useless if you use it in isolation. What you should do to avoid any false signals is to combine them with other indicators or chart patterns.
What is the best indicator to use in combination with the Zig Zag indicator?
The best indicator to use with the Zigzag indicator depends on your trading strategy.
Yet, you may find it easier to use when you combine it with chart patterns instead. Heads and Shoulders, double and triple top patterns, and Elliot Wave patterns are some of the most commonly used. Additionally, an excellent tool to use with the Zigzag indicator is Fibonacci retracement levels as it allows us to find areas where the price might retrace.
Risk Disclosure: The information provided in this article is not intended to give financial advice, recommend investments, guarantee profits, or shield you from losses. Our content is only for informational purposes and to help you understand the risks and complexity of these markets by providing objective analysis. Before trading, carefully consider your experience, financial goals, and risk tolerance. Trading involves significant potential for financial loss and isn't suitable for everyone.