What Are Moving Averages?
You know you are progressing with your learning when you arrive at this point in our lineup of courses. This time, we’ll be talking exclusively about the moving average, an essential tool for honing your trades like the professionals.
This piece takes a deep dive into what we consider one of the most popular areas of technical indicators, helping you to understand what it is, how to calculate it, its benefits, and limitations. At the end of your reading, you’ll be chuffed to have this tool in your technical analysis repertoire. So, let us get right to it.
What is a Moving Average?
The moving average, often referred to as “MA,” is a trend indicator that uses a line on the charts to show whether the market is uptrend or downtrend. It represents the average closing prices in the market over a specified period. To achieve this, the moving average finds the average of some data points over a specified period and plots the result as a line chart.
One of the great things about the moving average is that it is visually discernable. It displays as a line that smoothens out price action on a price chart. In this way, it serves as a good indication of trend direction, pending reversal, or a potential area of support and resistance.
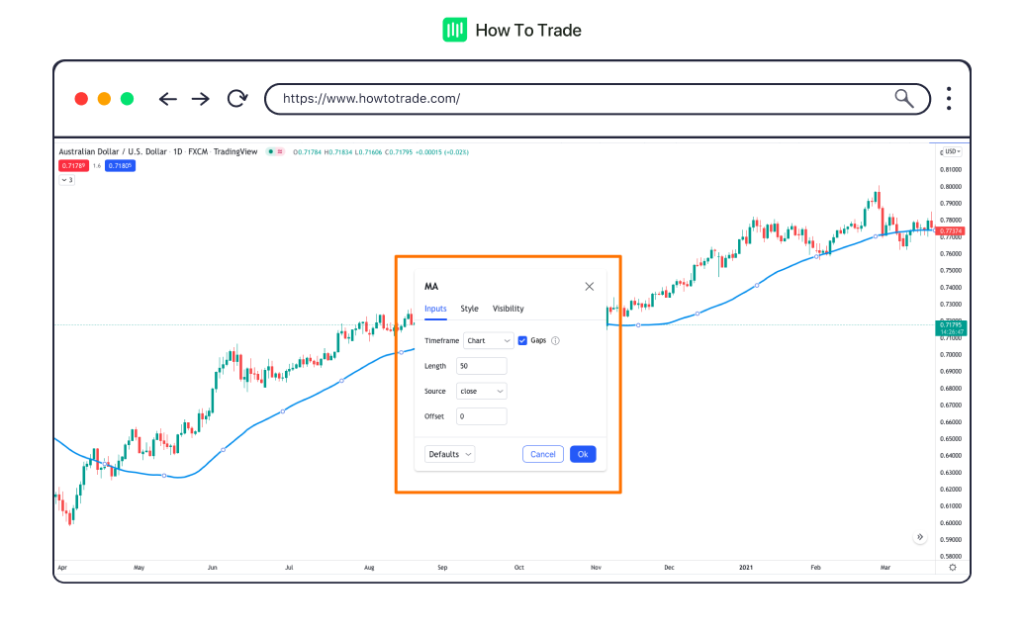
The image below shows the moving average as a single line on the same chart.

This kind of technical indicator is called a “chart overlay” because it plots the results directly on the price itself. This way, the moving average can quickly and efficiently create trading signals based on its position relative to price action. In technical analysis, the moving average is one of the most intuitive indicators.
Why Do Forex Traders Value Average Price?
The main reason for the popularity of the moving averages is that price action doesn’t move in straight lines. Instead, it moves in a zigzag fashion as the market bulls and bears fight for dominance. Moving averages help smooth out these random price movements. By eliminating the irregularities in the market, the moving average can analyze data points and give us an accurate view of market direction.
In fact, by just looking at the slope of the moving average, forex traders find it easier to determine the trend’s direction. This attribute is extremely valuable when making sense of recent data points.
After all, any analysis aims to have a clearer insight into the market and determine whether to buy or sell a forex pair for profit.
How to Calculate Moving Averages
Calculating a moving average requires some data, the amount of which depends on the period length in consideration. For any moving average, there are four inputs necessary for the calculation. They are the asset pair, the number of periods, the data point used, and the type of moving average. Let us consider each of these inputs.
1. Asset.
The first step in applying moving averages is to select a market. This means choosing one of the major, minor, exotic, or cross-pairs in forex.
2. Period.
Selecting appropriate time periods is essential to the moving average calculation. Generally, shorter periods are more up-to-date with the market dynamics, while longer periods help with macro technical analysis.
As such, a ten-day MA requires ten days of data, while a one-year MA requires 365 days of data.
3. Data Point.
It’s necessary to select a periodic data point by which to calculate the moving average. This data point references a particular feature of a candlestick. A data point may be a closing price, opening price, median, or mid of periodic price data.
4. Type.
There are many ways to calculate the Moving Average before plotting it on the price chart based on the information we wish to extract. A few of the most common types are the simple moving average (SMA), the exponential moving average (EMA), and the smoothed moving average (SMMA). The moving average types are perfect for various reasons, including identifying both the trend direction and strength of the trend.
How to Use the Moving Average in Your Forex Trading
To put it together, let us assume that you are a EUR/USD intraday trader interested in the basic view of a short-term price action on the 5-minute timeframe.
A good moving average for this scenario would be a 20-period SMA, which uses the closing price data point. You then add this MA to your chart. Usually, the market is bullish or uptrend when the price crosses above the moving average line. And whenever the price crosses below the moving average line, the market is bearish.
Usually, the moving average forex trading strategy isn’t more complicated than that. However, its effectiveness depends on the other trading tools it’s being used with.
Other moving average trading strategies revolve around what we call crossovers. A moving average crossover strategy involves the use of two or more moving averages with various lengths or periods. And whenever one crosses over the other, we get buy and sell signals.
Of course, there are advanced strategies that use the MA indicator. However, those aren’t for you yet.
Benefits of Moving Averages
The moving average indicator is a widely adopted technical indicator for technical analysis among forex beginners and experts. It is an indicator that helps traders identify the direction of price action in the market and opportunities for buying and selling. The following are some of the benefits of the moving average.
- They help identify market trends. The trend-following effect of the moving average helps traders determine the price action direction. For instance, a trader who doesn’t pull up the moving average on his price chart may see price action trending upwards based on the price movement they see. However, a moving average would help him identify if the image he saw was just a price retracement in an overall downward trend.
- Moving averages smooth out price fluctuations. The market exhibits a lot of price volatility as buyers and sellers wrestle to take the lead. This results in the zigzag movement of price that makes the chart somewhat chaotic. The moving average helps to cancel out this noise, helping traders focus on what is important.
- Many traders use moving averages as the dynamic support and resistance levels. Price action follows a pattern where they test these levels before bouncing back or breaking out.
- They also help traders generate signals. For instance, many traders buy the currency pair when the price action crosses above the moving average or sell when it crosses below it.
- Finally, many traders use moving averages to set their stop loss limits, helping them to reduce risks and manage their trades effectively.
Limitations of Moving Averages
While the moving average remains useful for gauging market activities, its limitations sometimes affect its accuracy. Some of the limitations of the moving average are as follows.
- Moving averages use historical data. Traders, therefore, assume that price action will continue in the trend that it had behaved. This is not always the case, as certain underlying factors, such as consumer behaviors, market conditions, and news, can create new trends.
- Moving averages are also sensitive to period length inputs. A faster MA (using a shorter period) tends to react more sharply to price movements than a slower MA (using a longer period). This holds negative implications for traders as they may sometimes generate false signals.
- For its data points, some inputs that the moving average uses may have extreme values. These values are the data point outliers. This tends to distort the overall presentation of the moving average and, hence, its accuracy.
- Finally, moving averages are ineffective in identifying sharp changes caused by fundamental factors. Events like a natural disaster, financial crisis, or monetary policy change can adversely affect price trends in a way that moving averages do not properly incorporate. That’s why the moving average is considered a lagging indicator
Key Takeaways
- Moving average indicators are technical tools for smoothing out market noise and identifying price trends.
- They can be used in multiple time frames, including minutes, hours, days, weeks, months, and years.
- The shorter the period, the fewer data points are included in the moving average calculation. This means that the moving average will stay closer to the current price.
- The longer its length, the more data points are included in the moving average calculation. This means that a single data point has a reduced impact on the overall average.
- There are many types of moving averages. Some prominent ones are the simple moving average, the exponential moving average, and the smoothed moving average.
Conclusion
Moving averages help gain insights, eliminate price irregularities, and identify trends. Traders incorporate moving averages in their trading strategies to identify opportunities in the forex market. While leveraging on the benefits of the moving average, it is crucial to always consider its limitations before making a trade decision.
Finally, the moving average is not just a forex trading tool. Other financial markets can benefit from the indicator.
In the following lessons, we’ll discuss two major types of moving averages: the simple moving average (SMA) and the exponential moving average (EMA). We’ll also teach you how to calculate them and explain the pros and cons of each. Once you know how simple and exponential moving averages work, you’ll be ready to integrate them into your trading.


Trade 1 Lot for just $2.5 commission*
- Trade 1,000’s of global markets.
- 0% deposit and withdrawal fees.
- Rapid funding turn-around times.
- Trade on MetaTrader 4 and 5.