Forex Chart Types and How to Read Them
Welcome to a crucial lesson in your forex trading education. In this lesson, we dive into the world of forex trading charts, indispensable tools in any trader’s arsenal. Think of forex charts as land mine detectors – they help you avoid disaster and stay profitable.
At the end of this lesson, you will be able to use several types of forex charts.
What are Forex charts?
A forex chart (also called a price chart) is more than just a series of price points—it’s the story of how currency pairs have interacted with market forces over a chosen timeframe. It’s a trader’s window into the Forex world, offering a visual context for analyzing currencies’ historical and current performances.
Forex charts are essential for technical traders, as they reveal how currency pairs have performed over a set period of time. These charts provide a framework within which traders can evaluate past trends to forecast potential price movements, which is the essence of technical analysis.
No matter your preferred trading method, you’ll need to know how to read forex charts – there really is no escaping it. Whether you are using a bar chart, candlestick chart, or line chart, the task is the same: identify positive expectation trade setups and cash in on the action.
How Do You Interpret a Forex Trading Chart?
Although charts may seem like rocket science at first glance, they’re really not that difficult to understand. They are user-friendly, and it’s pretty easy to understand how each price movement is presented over time. It’s all visual; there’s no heavy calculus or quantum physics to contend with.
Before pulling up a chart on your forex trading platform, it helps to understand a few basics. Here are the foundational elements of any forex chart:
- On forex price charts, the y-axis (vertical axis) represents the price scale, and the x-axis (horizontal axis) represents the time scale.
- Prices are plotted across the x-axis from left to right, with the most recent prices plotted furthest to the right.
Whether you are referencing a bar chart, candlestick chart, or line chart, these elements remain constant. All charts are simply visualizations of price action over a specified period.
Fun Fact: Back in the day, forex charts were drawn by HAND! One of the most common “old school” visualizations of price was the point and figure chart.
Charts have what we call timeframes. A timeframe is the unit of time through which you view the chart. For instance, if you’re on the 1-minute timeframe, your chart will show you how the market has performed in every one minute. And if you were on the 4-hour chart, you would be seeing how the price of your currency pair has moved in intervals of 4 hours for as far back as possible.
The most common timeframes are:
- Monthly
- Weekly
- Daily
- 4-Hour
- 15-Minute
- 5-Minute, and
- 1-Minute.
However, if you’re on a charting software like TradingView, you can choose any time interval as your timeframe.
What are the Forex Chart Types?
Before we dig deeper into more advanced aspects of technical analysis, let’s look at the five most popular types of price charts: line charts, bar charts, candlestick charts, Heikin Ashi charts, and Renko charts.
1. Line Chart
A line chart is the simplest type of forex chart. Line charts connect a series of selected price data points. The end product is a single line that moves from left to right, illustrating the peaks and troughs of price action. Common price points are opening and closing prices.

Line charts give us an easy-to-use representation of the past pricing of a currency pair. While they are not overly sophisticated, they can shed some light on a market’s state regarding trends and relative pricing.
2. Bar Chart
A bar chart is a type of forex chart that depicts the periodic behavior of a currency pair. In contrast to line charts, the bar chart includes more details about the price for every interval. They are:
- The opening price (O)
- The high price (H)
- The low price(L), and
- The closing price (C).
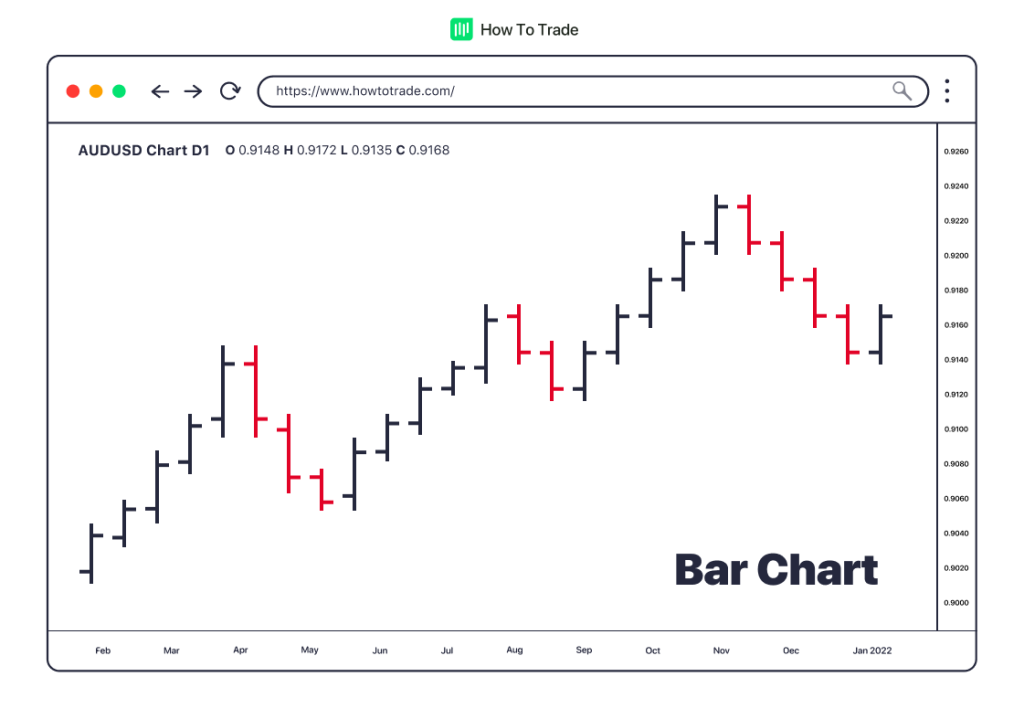
Given this information, bar charts are often referred to as OHLC charts. So, if you’re on a 5-minute chart, the bar chart shows the opening and closing price levels for every five-minute timeframe. It also depicts the highest and lowest price levels within the same timeframe.
For many forex traders, bar charts are a go-to technical device. Not only can they be used to discern market direction, but they also work well for a detailed study of periodic price movements. If you want more detail than a line chart, the OHLC bar chart isn’t a bad place to begin.
3. Candlestick Chart
Developed at the Dojima Rice Exchange by merchant Munehisa Honma, Japanese candlestick charts are among the most popular forms of technical analysis in use today. Traders from around the world rely on candlestick charts to further their forex chart analysis.

Basically, the candlestick chart shows everything that a bar chart shows: a currency pair’s trading range as well as the bullish or bearish sentiment. This is done by noting the opening, closing, high, and low prices.
However, candlestick charts take the analysis a bit further. By illustrating the “body” of each candle, it shows where the bulk of trade has taken place for a given period. In fact, many forex trading strategies rely on the bodies, wicks, and patterns local to candlestick charts.
4. Heikin Ashi
The Heikin Ashi chart is a variant of the candlestick chart used to identify market trends more clearly. “Heikin Ashi” means “average bar” in Japanese, and the chart uses average price data to create a smoother, more consistent trend line. It provides a cleaner view of the current trend by filtering out the noise and fluctuations of regular candlestick charts, making it easier to identify market direction with fewer distractions.
The Heikin Ashi chart is handy in trending markets. It helps traders stay with the trend and make better-informed decisions about entry and exit points.
5. Renko
Renko charts are unique because they are built using price movement rather than price and standardized time intervals like most charts. The word “Renko” comes from “renga,” the Japanese word for “brick.” True to their name, Renko charts display price movements in brick-like formations, where a new “brick” is formed only when the price moves by a predetermined amount.
Because time and volume are not considered in Renko charts, they can be advantageous for highlighting pure price movement with less noise. Traders use Renko charts to identify key support and resistance levels and to discern clear trends, disregarding the less significant price movements that might distract from the overall trend.
So, Which Chart Type is Better?
If you’re interested in trading forex charts, the choice chart type to use is yours. However, it’s important to make sure that you use a chart complementary to your strategy. After all, it helps immensely to put price movements into a useful context.
What do we mean by that? Let’s look at a quick example. Assume you are an intraday scalper, looking to take small pips off the EUR/USD. In this case, a monthly EUR/USD line chart isn’t going to do you much good. A better choice would be either a 5-minute bar chart or a 30-minute candlestick chart.
Remember, choosing the right chart for the job hinges on the type of information that you need to trade. If you’re investing in long-term trends, a monthly or yearly line chart may work fine. If you’re an intraday trader, a one-hour or 30-minute candlestick chart is a solid choice.
Key Takeaways
- Forex trading charts are essential for technical analysis. They help traders understand past and current price movements and forecast future trends.
- Understanding how to read various chart types like line, bar, candlestick, Heikin Ashi, and Renko charts is crucial for successful forex trading.
- Each type of forex chart provides different levels of detail, from the simple trends in line charts to the detailed price information in candlestick charts.
- The choice of chart type should align with a trader’s strategy, with different charts suited for different trading styles, such as intraday scalping or long-term trend analysis.


Up To $5,000 Credit!
- Trade 1,000’s of global markets.
- 0% deposit and withdrawal fees.
- Rapid funding turn-around times.
- Trade on MetaTrader 4 and 5.