How to Use Fibonacci Retracement?
The Fibonacci sequence is a famous, widely applied numeric device first developed by Italian mathematician Leonardo da Pisa in the early 1200s. It is primarily expressed by the “golden ratio,” a staple of modern geometry, algebra, and physics.
When it comes to financial markets, the golden ratio is applied via many forms of the Fibonacci indicator. One of the most famous is the Fibonacci retracement tool.
So, let’s talk Fibonacci retracements, shall we?
What are Fibonacci Numbers?
From a mathematical standpoint, Fibonacci numbers are integers that are the sum of their preceding two numbers in the Fibonacci sequence. The sequence unfolds like this: 0, 1, 1, 2, 3, 5, 8, 13, 21, 34, 55, 89, 144, 233, and it goes on. Here’s a fascinating twist: when you divide any two successive Fibonacci numbers (beyond 3), the result inches closer to the golden ratio of 1.6180. While there is a bit more to the discussion than this, let’s keep things simple for now!
The golden ratio is the basis for the application of the Fibonacci sequence within forex trading. Every forex Fibonacci trading strategy is related to the golden ratio in one form or another. Now, let’s talk about the most popular: Fibonacci retracement tools.
What are Fibonacci Retracement Levels?
These Fibonacci tools aren’t one-size-fits-all; they come in various shapes and sizes, each with its unique role. Among the most popular Fibonacci tools are expansions, spirals, and retracements. While the others certainly have positive attributes, many a forex trading strategy is based on the most famous Fibonacci tool: the Fibonacci retracement level.
Based on basic price action theory, Fibonacci retracement levels are considered a predictive technical indicator. The assertion maintains that after the price begins a new trend direction, it often returns – or retraces – proportionally before resuming in the original direction. By applying Fibonacci ratios to a directional move in price, one can contextualize market behavior in three ways:
- The market is trending.
- The market is reversing.
- The market is consolidating.
How do active forex traders apply Fibonacci retracement levels in real time? By scrutinizing price with respect to these key Fibonacci retracement levels:
- 38%
- 50%
- 62%
- 78%
How to Trade Trends With the Fibonacci Ratio
By considering Fibonacci levels, it’s possible to discern the market’s state. This is done by applying the important Fibonacci ratios from a market’s periodic trough to peak (or peak to trough). The shorter distance that price pulls back, the stronger the trend; the deeper the pullback, the weaker the trend.
Also, forex traders use Fibonacci retracements as potential support and resistance areas that they believe are applicable to a trending market. Upon spotting these zones on a price chart, traders can make strategic moves:
- Go long (buy) on a retracement at a Fibonacci support level when the market is in an UPTREND.
- Go short (sell) on a retracement at a Fibonacci resistance level when the market is in a DOWNTREND.
The mathematical harmony of Fibonacci numbers and formulas could enable you to anticipate future price points. This is extremely useful information for any forex trading strategy. Fibonacci retracement levels rule!
How to Apply Fibonacci Retracements
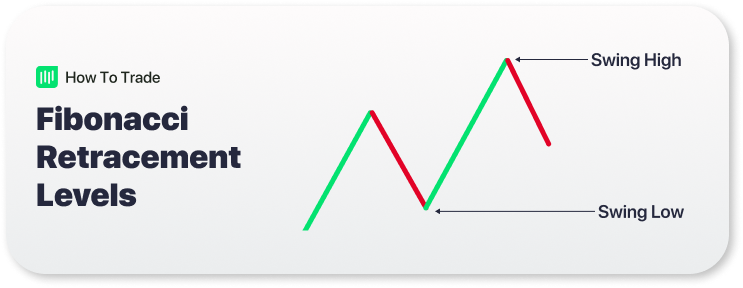
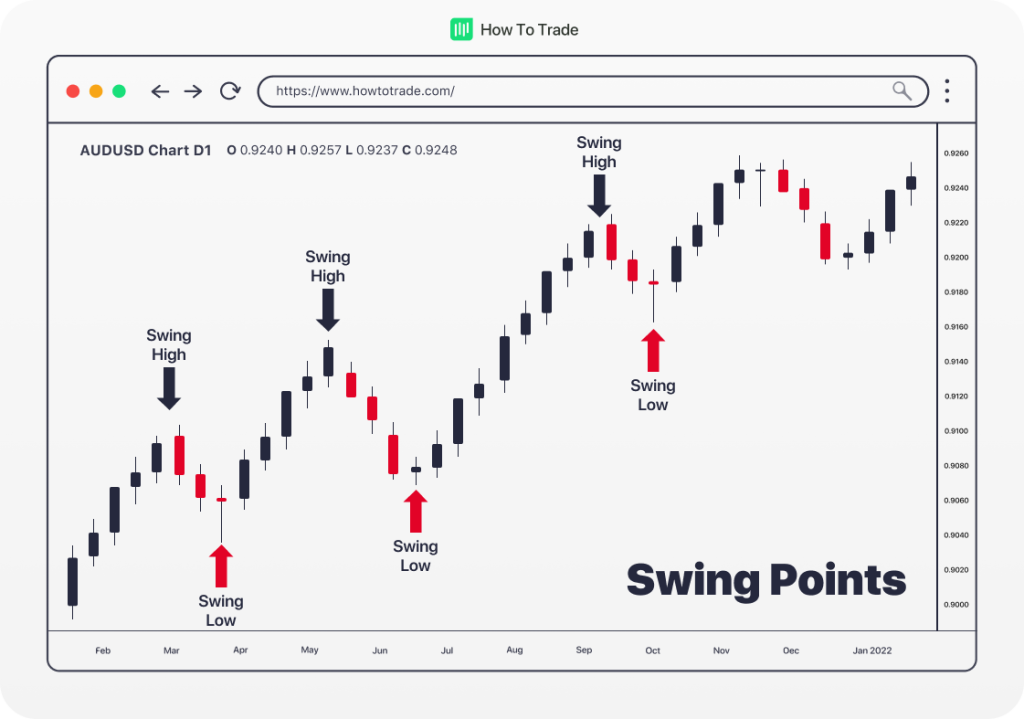
To find and apply Fibonacci levels to the chart, you’ll need to identify Swing High and Swing Low points. Don’t worry- the process isn’t too involved. All you need is a previous price level relative to a periodic high and low:
- A Swing High is a candlestick with at least two lower highs on both the left and right of itself.
- A Swing Low is a candlestick with at least two higher lows on both the left and right of itself.
Pretty easy, right? Well, applying the Fibonacci retracement to your price chart isn’t complicated. Here are the basics:
- For downtrends, click on the Swing High and drag the cursor to the most recent Swing Low.
- For uptrends, click on the Swing Low and drag the cursor to the most recent Swing High.
As a result, the Fibonacci tool gives us a clear look at potential support or resistance levels. It appears something like this.
Let’s explore how to use these Fibonacci levels below.
How to Use the Fibonacci Retracement Tool in an Uptrend
Let’s use this daily AUD/USD chart as our example of using Fibonacci Retracement Levels in an uptrend.
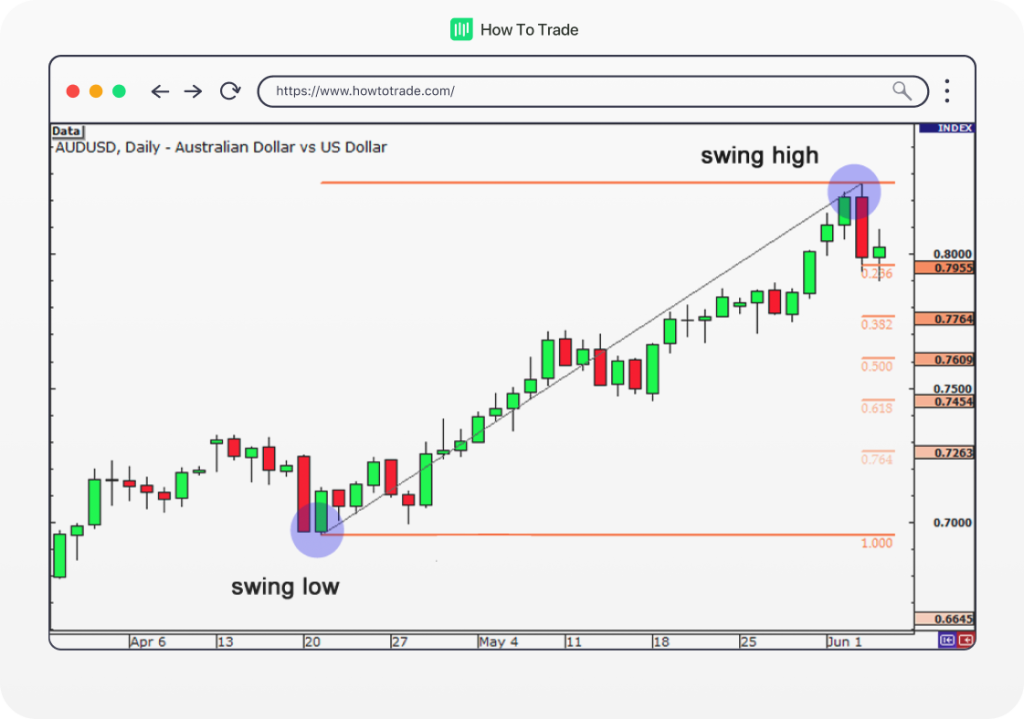
We plotted the Fibonacci levels on the Swing Low at 0.6955 on 20th April and dragged the cursor to the Swing High at 0.8264 on the 3rd of June. Once we did that, the charting software (MT4) showed us the retracement levels based on our Fibonacci ratios.
Analysis
As you can see, the chart revealed retracement levels at 0.7955 (23.6%), 0.7764 (38.2%), 0.7609 (50.0%), 0.7454 (61.8%), and 0.7263 (76.4%). It’s important to remember that many forex strategies don’t respect 23.6% as an accurate Fibonacci level. Also, it’s commonplace to see 62% and 78% instead of 61.8% and 76.4%.
We expected the AUD/USD to retrace from the recent high and find support at one of the Fibonacci retracement levels because traders would be placing buy orders at these levels as the price pulls back.
Let’s have a look at what happened next.
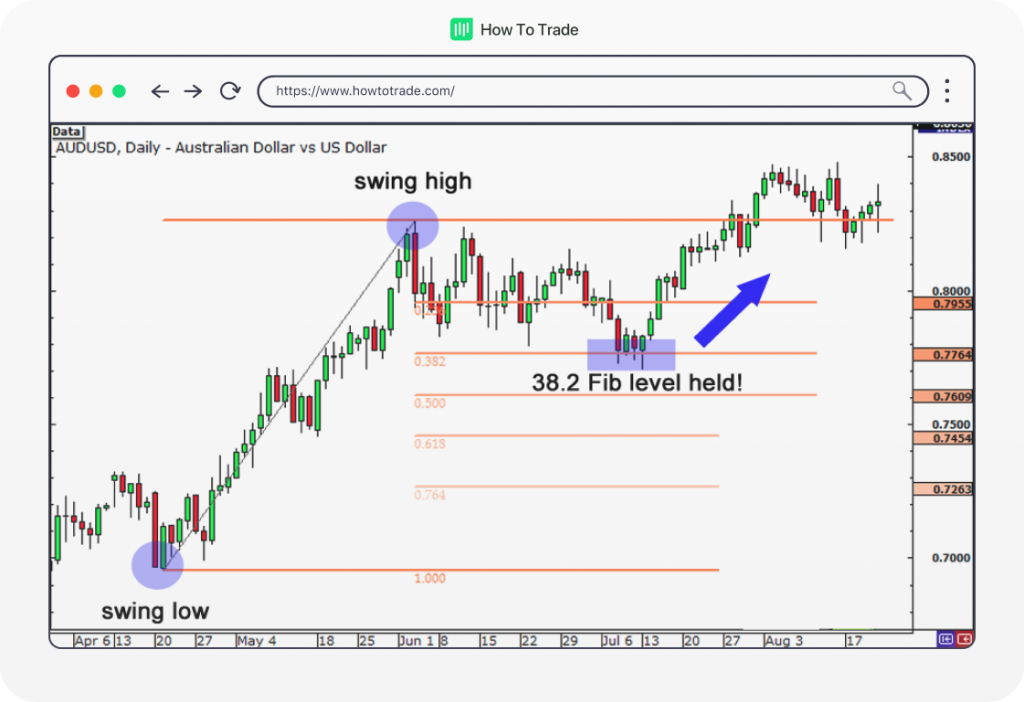
Observe how the price seamlessly retraced through the 0.7955 Fibonacci level and continued to shoot down over the next few weeks. It even tested 0.7764, but it was unable to close below it. Then, sometime around the 14th of July, the market resumed its upward move and eventually broke through the Swing High.
So, if you were to buy at the 0.7764 (38.2%) Fibonacci level, it would have made a profitable long-term trade. This is how the Fibonacci sequence is used to identify potential support and resistance levels from previous price action.
How to Use the Fibonacci Retracement Tool in a Downtrend
Let’s use this daily EUR/USD chart as our example of using Fibonacci retracement levels in a downtrend. It’s a lot like the uptrend retracement level analysis, only inverted.
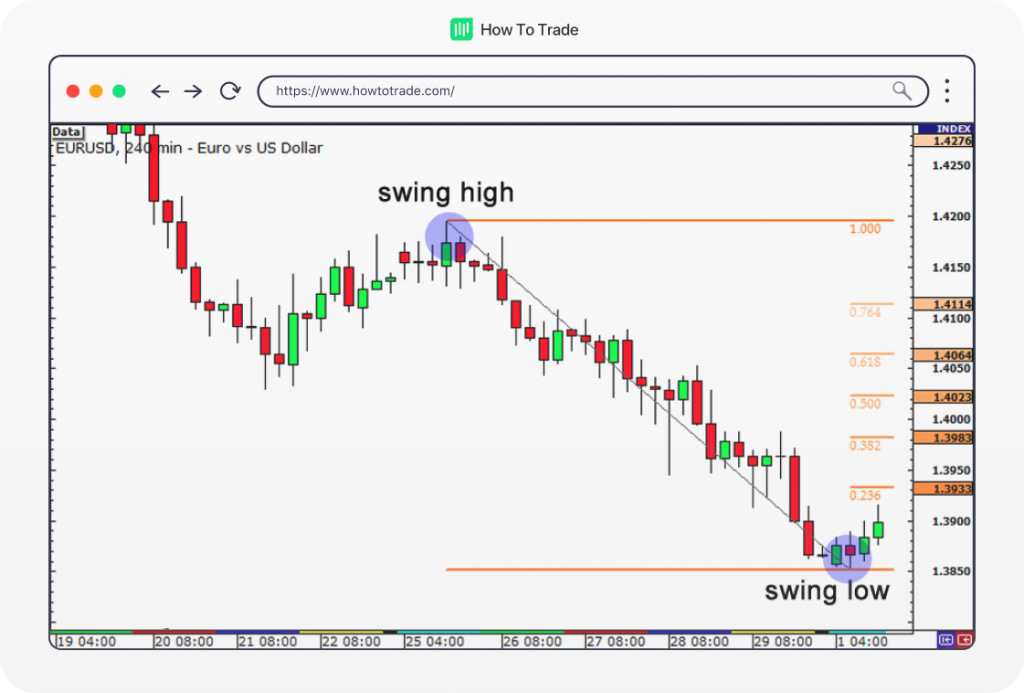
We plotted the Fibonacci retracement levels on the Swing High at 1.4195 on 25th January and dragged the cursor to the Swing Low at 1.3854 on the 1st of February. Once we did that, the charting software (MT4) showed us the retracement levels.
Analysis
As you can see, the Fibonacci retracement levels were 1.3933 (23.6%), 1.3983 (38.2%), 1.4023 (50.0%), 1.4064 (61.8%) and 1.4114 (76.4%). Of course, different traders will debate on the precise location of Fibonacci retracements.
We were expecting the EUR/USD to retrace from the recent low and potentially encounter resistance at one of the Fibonacci retracement levels because traders who want to play the downtrend at better prices may be ready with sell orders there.
Were we right? Let’s have a look at what happened next.
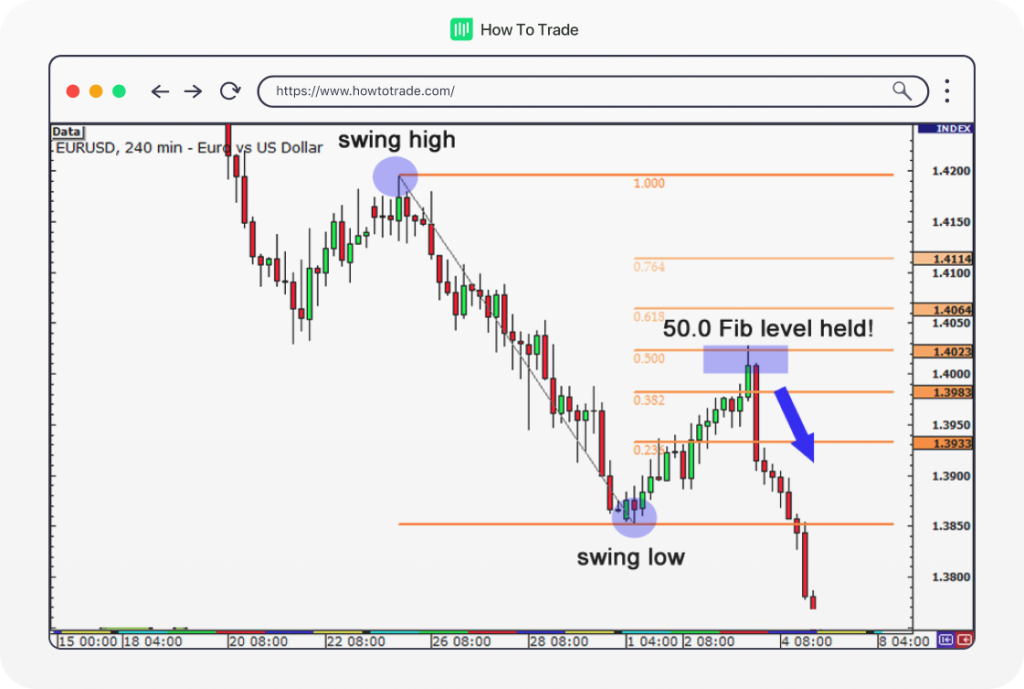
Isn’t that beautiful? The market did try to rally, stalling below the 1.3983 (38.2%) level for a bit before testing the 1.4023 (50.0%) level. If you had placed orders at the 38.2% or 50.0% Fibonacci retracement levels, you would have made some mad pips, mate!
How to Apply Fibonacci Retracements to Your Forex Trading
Reflecting on our examples, it’s evident that we identified temporary support and resistance zones at Fibonacci retracement levels. However, it is important to remember that while Fibonacci retracement levels give you a higher probability of success, price won’t ALWAYS bounce from these levels, and they should be looked at only as areas of interest. Not definite indicators.
Key Takeaways
- Fibonacci retracement, a popular tool in forex trading, is based on the golden ratio derived from the Fibonacci sequence, offering predictive insights into market trends and reversals.
- The key Fibonacci retracement levels help traders identify potential support and resistance areas, guiding buying and selling decisions in uptrends and downtrends.
- Applying Fibonacci retracement involves identifying Swing High and Swing Low points in price charts and predicting potential future support or resistance levels.
- In uptrends, buying at Fibonacci support levels is advisable, while selling at Fibonacci resistance levels can be profitable in downtrends.
- Although Fibonacci retracement levels offer a higher probability of success in predicting market movements, they should be combined with other tools for more accurate analysis, as they are not always definitive indicators.
In the next lesson, we will show you why it is important to hone your skills and combine the Fibonacci retracement with other tools, such as support and resistance levels and candlesticks, to give you a higher probability of success.


0% Commission Accounts
- Trade 1,000’s of global markets.
- 0% deposit and withdrawal fees.
- Rapid funding turn-around times.
- Trade on MetaTrader 4 and 5.