


The Pivot Point is a popular indicator that identifies strong inflection points in the market where price action reverses or continues in the existing trend. These are pivot points of support and resistance where the price often reacts.
- The Pivot Point is a popular technical analysis indicator that shows market support and resistance levels.
- Price reversal and breakout strategies are used for trading the Pivot Point indicator.
- Pivot Point indicator works well in a support and resistance trading strategy. It effectively combines with the RSI and MACD indicators too.
This piece will adequately inform you about the Pivot Point indicator, its trading strategies, benefits, and limitations. Now let us dive right in.
What is the Pivot Point Indicator?
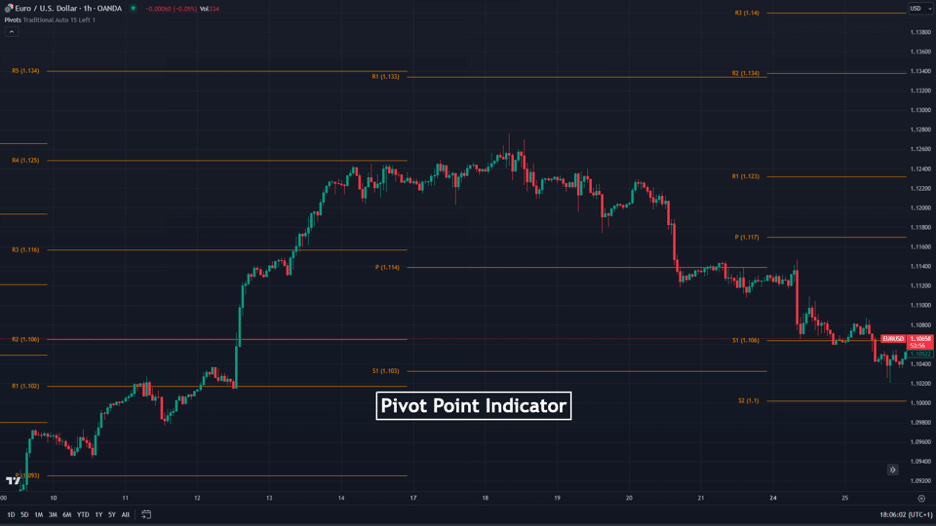
The Pivot Point indicator is a standard tool among traders for identifying market support and resistance levels. Mostly, Pivot Points are used by short-term traders, although they can also be used by long-term traders. These levels of support and resistance are points where the price often reacts, hence, reverses or pauses before continuing in the same direction.
Here’s what the pivot points indicator looks like on a price chart:
To get a wrap of what support and resistance levels are in the market, let us refresh our mind briefly on a basic economic principle – demand and supply.
The principle of demand and supply states that when the demand for an asset increases, there is a corresponding price increase. The price tends to fall when there is an abundant supply of the same asset in the market. This principle backs up the emergence of trends in the market up to a point where there is an equilibrium between buyers and sellers. That is the basic idea behind the supply and demand trading strategy.
A shift in this balance in the opposite direction causes the price to reverse. The reversal often occurs in the same region in the market, paying significance to a support or resistance level in that region, as the case may be. And that’s why the Pivot Point indicator is such a valuable trading tool. It Helps traders to figure out these levels, which can then be used to enter or exit a trade.
How Does the Pivot Point Indicator Work?
The standard Pivot Point indicator compares each successive period’s high, low, and closing price. Most traders use the five-point system to calculate pivot points. It then creates arbitrary levels of support and resistance based on the following pivot point calculation.
- P = High + Low + Close3
- R1 = (P x 2) – Low
- R2 = P + (High – Low)
- S1 = (P x 2) – High
- S2 = P – (High – Low)
Where :
- P = Pivot Point price
- R1 = Resistance 1
- R2 = Resistance 2
- S1 = Support 1
- S2 = Support 2
Note that the indicator draws its primary Pivot line somewhere in the middle below resistance lines (R1 and R2) and above the pivot and lines of support (S1 and S2). While price action often makes a reversal around these lines, it sometimes does not.
Generally, there are five different types of pivot points: Woodie pivot points, Camarilla pivot points, Demark pivot points, Fibonacci pivot points, and Standard pivot points. The Pivot point indicator may look similar to the Fibonacci retracement tool in function, but its workings have some differences. The Fibonacci Pivot Points are lines drawn as a range of definite percentages from any specified price point. This means the Fibonacci levels will also change as long as the reference price point changes.
On the other hand, the Pivot Point levels do not change as they are lines drawn from an average of the previous period’s high, low, and closing prices, which do not change once set for a particular period. This makes the Pivot Point a preferable indicator for traders who utilize the scalping strategy, the day trading strategy, and the swing strategy.
How to Use The Pivot Point Indicator in Trading?
It is possible to trade the Pivot Point indicator using various strategies devised by traders over time. Technically, the pivot point indicator, much like Fibonacci retracement levels, can be used as an extra tool to identify trade opportunities. As such, traders can use it for any market scenario.
So, in this article, we discuss three prominent use cases for the pivot point indicator: trend identification, trend reversal and break-out strategies. Let’s get into the details of these strategies.
Trend Reversal Strategy
With the trend reversal pivot point trading strategy, also known as the pivot point bounce trading strategy, you look out for price action to make a U-turn after getting to any of the support or resistance levels of the indicator.
When this happens, you should enter a buy position when price action dips to a support level and subsequent candlesticks show an upturn in events. Do this by placing a buy limit order to ensure the price dips below the support line before reversing into a buy. Set your stop loss at the closest lower low from the entry point and take profit at the following resistance line of the indicator.
Conversely, when the price action reaches a certain resistance level and cannot break it, you can use this level to enter a short-sell position.
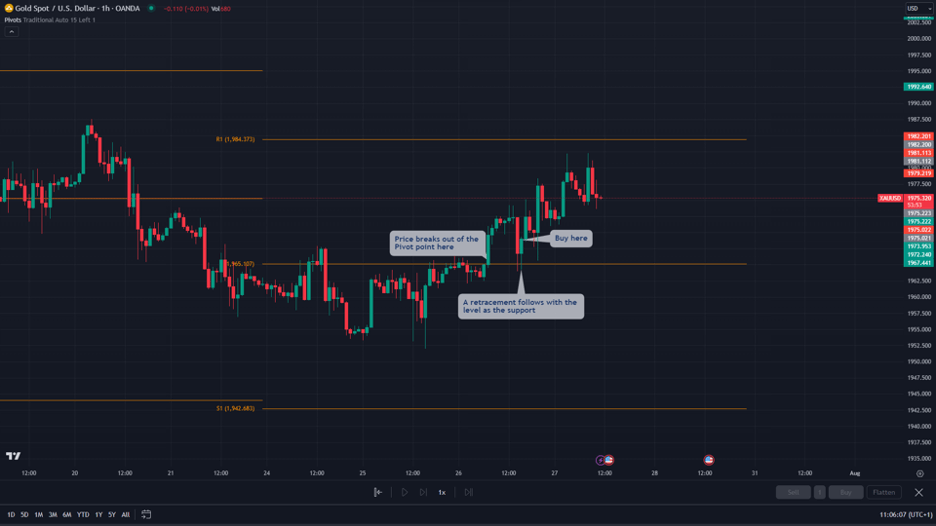
Breakout Strategy
The pivot point breakout trading strategy involves observing that price action continues in an existing trend after reaching a line of support or resistance instead of making a reversal. Typically, a breakout happens following a period where the market is in a range-bound position, and the asset’s price cannot break a certain level several times. A breakout is typically a technique of trading the range trading strategy, along with trading inside a range.
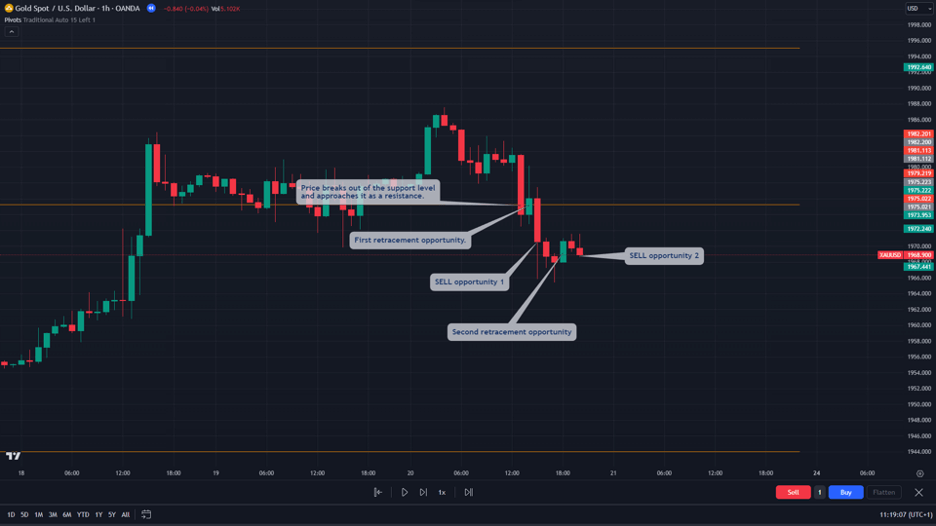
To make a pivot point breakout trade, place a buy order when price action reaches a resistance level and breaks out of it, continuing upward. Conversely, place a sell order when the price hits a support level and continues in a downward trend. Set stop loss and take profit levels using the same approach as the trend reversal strategy.
Pivot Point Indicator Trading Strategy Tutorial
Now, let’s see an example of how to trade with the Pivot Point indicator. In general, the Pivot Point indicator works best when combined with other indicators, such as the RSI and MACD, and deploys unique strategies that enhance results. However, it can also be used in isolation without any other indicator.
Below, we will show you how to use the pivot point indicator on its own and how to use it in conjunction with other technical analysis indicators that can help you confirm the pivot point indicator signals.
Pivot Point Support and Resistance Trading Strategy
One way to use the pivot point indicator is to use it as a price level with high buying and selling pressure. In that aspect, many traders who utilize the naked trading strategy add the pivot point indicator to determine where the price may retrace or continue in the same direction.
This price level can serve as an area where there’s a large volume, especially when considering the fact that many traders look at pivot points. Therefore, some traders use the indicator in isolation as it enables them to see crucial price levels where they can enter or exit a trade.
To use the pivot point indicator without any other indicators, follow these steps:
1. Launch your Pivot Point indicator on your chart, preferably on an intraday trading timeframe like the 1-hour.
2. The market is bullish if the price is above your pivot point. In this market scenario, buy when the price retraces to the pivot point and bounces away from a support level.
3. The market is bearish if the price is below your pivot point. In this case, sell when the price retraces to the pivot point and bounces away from it from the resistance level.
4. Place a stop loss at the nearest swing low for a buy entry and at the nearest swing high for a sell entry.
Note that when using this method, you rely strictly on the Pivot Point indicator. Therefore, upon using this technique of the pivot point indicator on its own, you must be careful and use risk management tools. Also, keep in mind that this technique typically suits scalp or day traders looking for short-term trades.
Pivot Point Indicator with RSI and the Moving Average Convergence Divergence (MACD)
Even though you can use the pivot point indicator without any indicator, adding other indicators as a confluence trading tool can significantly help you predict future price movements. For example, the Pivot Point indicator works extremely well with the RSI and MACD indicators. The RSI oversold and overbought levels can help you confirm pivot point signals when price action reaches the Pivot Point indicator’s support and resistance levels. The MACD indicator helps you understand the market momentum and trend.
Here’s what you need to do to trade the Pivot indicator with the RSI and MACD:
1. Launch your Pivot Point, RSI, and MACD indicators on your chart.
2. Observe the trend direction using the method described in the previous section. Launch your Pivot Point indicator on your chart, preferably on an intraday trading timeframe like the 1-hour. Go to the indicator’s settings to adjust the pivot timeframe to daily or weekly (to get higher accurate pivot point values). Also, in the settings, uncheck every support and resistance level apart from the Pivot point.
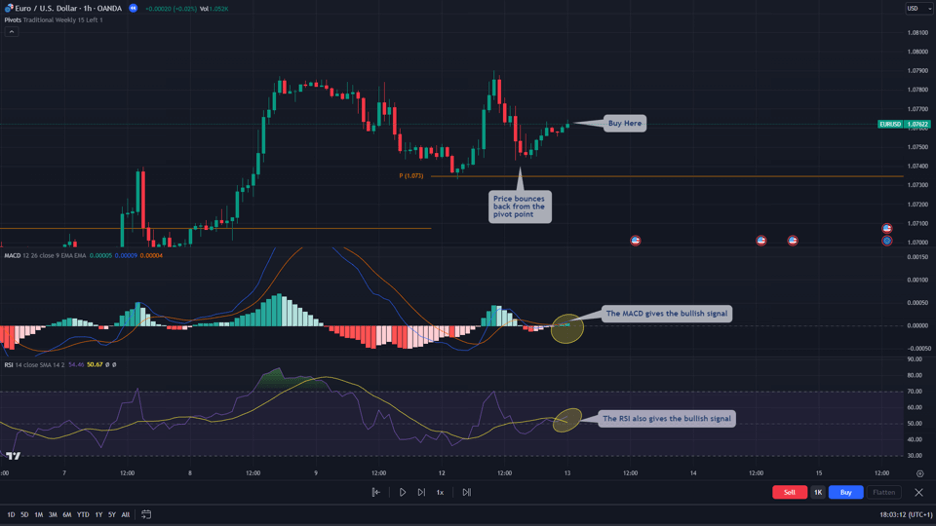
3. Wait for price action to approach the pivot point as a support or resistance. Prepare for a trade.
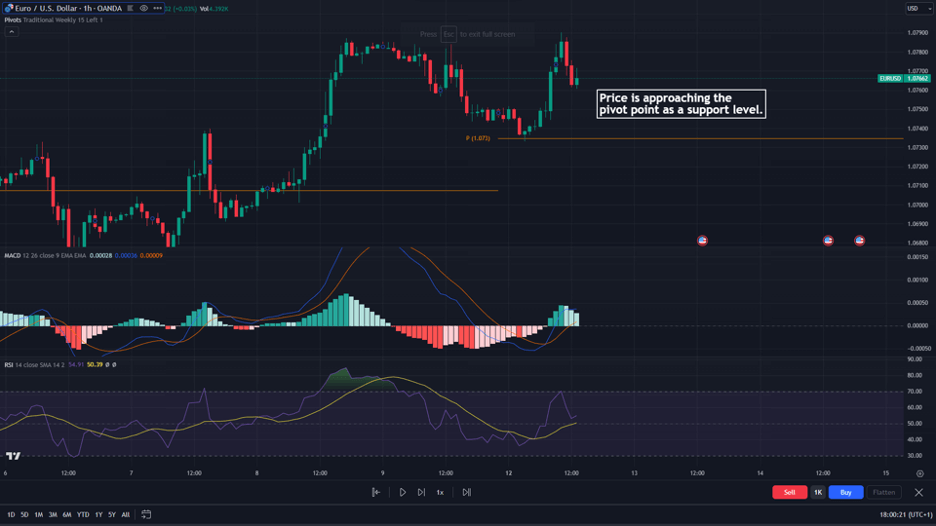
4. At this point, you’re waiting for a price reversal at the pivot point level. Your trading signal comes when either the MACD or RSI gives you a signal in the direction of the rejection. Buy or sell there. As seen in the image below, a buy signal is made when there’s a confirmation from both the RSI and MACD.
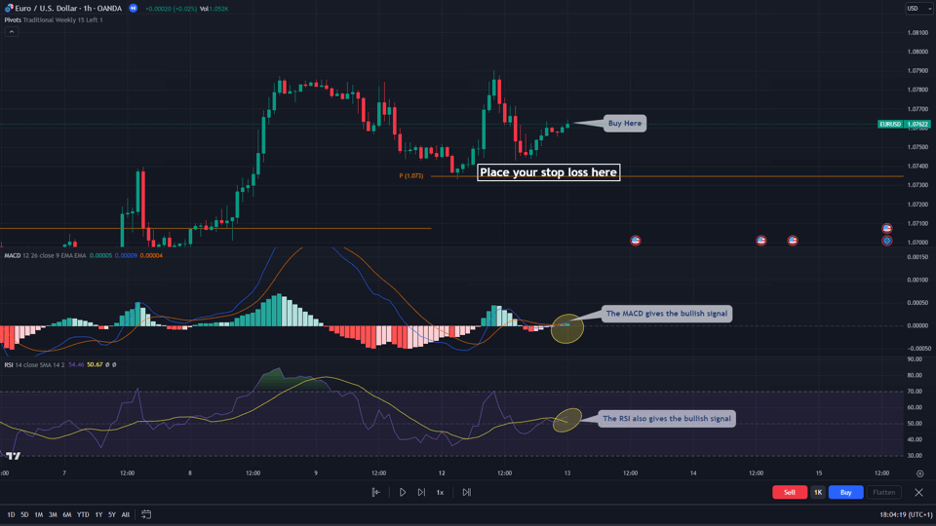
5. Place your stop loss above the pivot point level in a bearish trade and beneath the level in a bullish trade. In our trade example, stop loss order should be located below the pivot point level, as seen in the EUR/USD chart below.
Pivot Point Indicator – Pros and Cons
The pivot point indicator helps identify support and resistance levels in the market, and combining it with other strong indicators makes it even more reliable. However, it does have its limitations too. We discuss some benefits and limitations of the pivot point indicator below.
Benefits of Using the Pivot Point Indicator
The Pivot Point indicator finds support and resistance levels. In fact, this is the most fundamental use of the Pivot Point Indicator. Another strength of the indicator is that it is very compatible with other indicators.
Furthermore, much like Fibonacci retracement levels, one factor that makes the pivot point indicator so effective is that many traders follow these numbers. Therefore, due to the herd behavior in financial markets, these price levels become even more crucial in identifying trade entry levels.
In sum, these are the benefits of the Pivot Point indicator listed below.
Pros
- The DeMarker indicator helps to identify when price action changes direction in a trend
- The Pivot Point indicator offers valuable support and resistance levels, particularly for short-term trades
- It can be easily added to charts for quick analysis
- It helps identify potential trend reversals and breakouts
- The Pivot Point indicator is highly effective for scalp and day traders who aim to take profits after short terms
Limitations of the Pivot Point Indicator
The key limitation of the Pivot Point indicator is that it is not self-sufficient. Using it on its own can give many false signals. You achieve much better results when combined with other relevant trading tools. Some limitations of the Pivot Point indicator are as follows.
Cons
- It may be less effective in strongly trending markets
- It should not be solely relied upon for trading decisions
- The Pivot Point indicator is less effective for long-term trading
Key Takeaways
- The Pivot Point indicator is one of the five different types of pivot points – Woodies, Camarilla, Demark, Fibonacci, and Standard pivot points.
- Using the Pivot Point indicator can enhance a trader’s ability to identify potential entry-level points and plan trading strategies accordingly.
- Since Pivot Points are primarily used to identify price pullbacks, trading strategies for the Pivot Point indicator include price reversals and trading pivot point breakouts.
- Combining the indicator with other technical tools, such as the RSI and MACD, is crucial to understand market conditions better.
Frequently Asked Questions About Trading the Pivot Point Indicator
The following are some of the most commonly asked questions about the Pivot Point Indicator.
How accurate is the Pivot Point indicator?
The accuracy of the Pivot Point indicator depends on market conditions and the trader’s ability to use it effectively. While it provides valuable support and resistance levels, it should be complemented with other indicators and analysis methods for more reliable signals. That said, the Pivot Point indicator is certainly a relabel one, especially when considering that many traders look at these numbers daily.
What is the correct way to trade with the Pivot Point indicator?
The right way to trade with the Pivot Point indicator involves combining it with other technical indicators to confirm potential trading opportunities. Traders can use the indicator to identify resistance and support levels and then analyze price action and other indicators to make informed decisions and find crucial price points. Technically, since Pivot point indicators are used to identify pullbacks, trading with pivot points mainly involves the reversal or the pivot point breakout strategy.
Do professional traders use the Pivot Point indicator?
Absolutely, experienced traders often use the Pivot Point indicator in their technical analysis toolkits. However, they typically combine it with other indicators and tools to gain a comprehensive market view and make well-informed trading decisions.
Risk Disclosure: The information provided in this article is not intended to give financial advice, recommend investments, guarantee profits, or shield you from losses. Our content is only for informational purposes and to help you understand the risks and complexity of these markets by providing objective analysis. Before trading, carefully consider your experience, financial goals, and risk tolerance. Trading involves significant potential for financial loss and isn't suitable for everyone.


