


The Volume Profile indicator measures the volume of trading activities around each price level on any given asset. Many professional traders rely heavily on this indicator to determine the strength of trends, as a trade management tool, or as a dynamic support and resistance level.
- The Volume Profile is a technical analysis indicator that measures the volume of trading activities around price levels.
- It appears on your chart as a series of horizontal histogram bars.
- It is one of many kinds of Volume profile indicators, including candlestick volume profiles, session volume profiles, and visible range volume profiles.
- The volume profile is a useful trading tool for all traders and markets.
In this piece, we’ll show you everything you need to know about Volume Profile indicators, including how to use them in your trading strategies.
- What is the Volume Profile Indicator?
- What are the Main Components of the Volume Profile Indicator?
- How to Use the Volume Profile Indicator in Trading?
- Volume Profile Indicator Trading Strategy
- What are the Benefits and Limitations of the Volume Profile Indicator?
- What are the Differences Between the VPVR, Session Volume Profile, and the Candlestick Volume Profile indicators?
- Key Takeaways
- Frequently Asked Questions
What is the Volume Profile Indicator?
The Volume Profile indicator measures the total volume of trades at every given price level over any period of time. The idea behind this is that the more trading volume a price level has gathered, the more likely there is to be a support or resistance level at that level.
You could say the Volume profile indicator gives context to your trading. And this is one of the mistakes novice traders make; they trade without context. The context here refers to whether the market is active around the time and price level you’re trading on.
In general, tracking volume is critical in trading as it allows you to see where big institutions or large investors enter the market. It is the logic behind some of the most popular and widely used trading strategies, such as the order blocks trading strategy, supply and demand, and the range trading strategy.
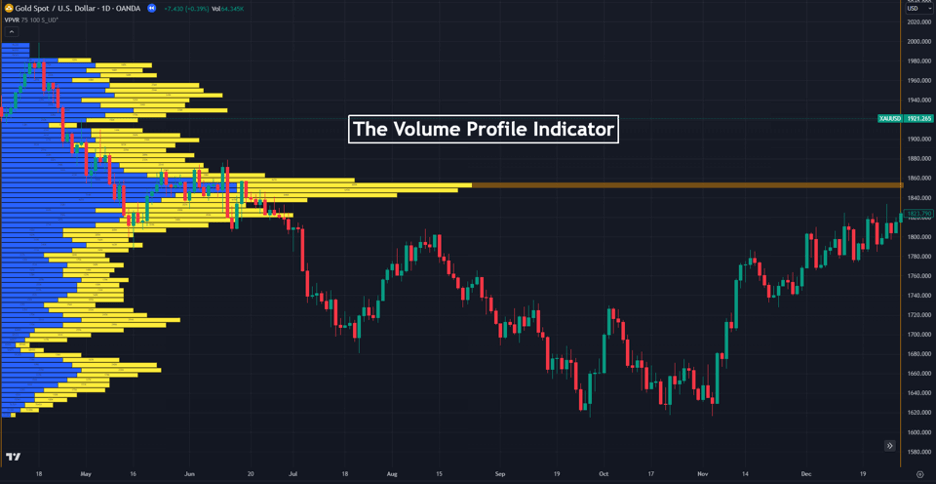
And that’s why the volume profile indicator could be an effective trading tool. It helps you to clearly see the price levels at which there’s high trading activity on a price chart. Here’s what it looks like on a price chart:
In trading, a buy or sell signal can spring up anywhere, depending on the trading strategy or the trading tools you’re using.
But the volume of supply and demand dynamics is really what pushes the price in one direction or the other. So, when you have a trading signal, but there are no volume or low volume nodes to back it up, you could get yourself into frustrating market scenarios.
This is where the volume profile comes in. Since volume is what normally pushes prices in a specific direction, the volume profile indicator can help you predict future price movements. It basically tells you if there is enough volatility at your trade entry price level to drive the price to your take profit level.
What are the Main Components of the Volume Profile Indicator?
The Volume Profile indicator has four main components. They are:
1. Point of Control (POC)
This is the most crucial level within the Volume Profile. It’s a horizontal line that intersects the histogram at the price level with the highest volume traded during the chosen timeframe. The POC represents the price where supply and demand were most balanced, indicating a potential area of equilibrium in the market. That’s why traders see the POC as the fair value of that asset during that session.
Traders often use the POC as a reference point for determining potential support or resistance levels. And in a balanced market, the POC tends to attract price action, acting as a magnet where buyers and sellers converge.
2. Value Area (VA)
The Value Area is a specific zone within the histogram that captures a user-defined percentage of the total trading volume (typically 70%, but this can be adjusted). This area helps traders identify where the bulk of trading activity occurred and serves as a reference for potential support and resistance zones.
The size of the VA also matters to traders. A narrow Value Area suggests a strong consensus on price and potentially increased volatility. On the other hand, a wide Value Area suggests indecision or uncertainty in the market.
3. High Volume Node (HVN)
These are areas on the histogram with long bars representing significant buying or selling pressure concentrated at those specific price levels. They indicate a surge in trading activity at a particular price point. HVNs act as strong support or resistance levels because they represent areas where traders have shown considerable interest and activity.
4. Low Volume Node (LVN)
These are areas on the histogram with short bars representing relatively low trading activity at those price levels. They indicate a lack of buying or selling interest at those specific prices. LVNs can indicate areas of potential price acceleration or fast moves because there is less trading activity to provide resistance or support. That is why traders watch these levels for potential breakout or breakdown points, where prices can move quickly in the direction of the breakout due to lower liquidity.
How to Use the Volume Profile Indicator in Trading
There are various ways to use the Volume Profile Indicator. In fact, there are also various types of Volume Profile indicators. Some measure the volume profile, meaning the total volume traded over a specified time period. They’re called Session Volume Profile Indicators. Some others measure the volume profile on every candlestick, called Candlestick Volume Profiles.
The Volume Profile indicator we’ll be referring to for the rest of this piece is the Volume Profile Visible Range (VPVR), which shows the volume profile of all the candlesticks currently visible on your chart.
Now, let’s take a look at the different ways you can use the volume profile indicator to improve your trading system.
Dynamic Supports and Resistances
The VPVR already has its Point of Control (POC) for a support/resistance level. The Point of Control is the longest horizontal bar, and it signifies the level with the highest level of price activity.
It also has areas of high-volume nodes that appear as long horizontal rays on the chart. These levels can serve as dynamic support and resistance levels. And since the indicator automatically adjusts its signals depending on the visible candle sticks on the current charts, the Point of Control also changes. At the same time, the high-volume profile areas also change, thereby giving you more dynamic supports and resistances.
Identify Potential Take Profit and Stop Loss Targets
Another way to use the VPVR is as a potential take profit and stop loss target. This is because price often gets attracted to areas of high volume profile. So, when making trades, you can place your stop loss or take profit levels around the value area of a high-volume profile.
Determining the Strength of Trends
One more way professional traders make use of the VPVR indicator is by using it to determine the strength of trends. Typically, if there’s a high trading volume at a specific price level or specified price levels, it can be used to enter a position. And this is how you can determine the strength or weakness of a trend.
For instance, if a trend is approaching price levels with low volume profiles, there might not be enough volatility in the market to keep the trend going, thus marking the potential end of the trend. On the other hand, when you notice one of the following – a certain chart pattern, a breakout level out of a range-bound area, or a signal from other technical analysis indicators – along with a high volume point, you can use it as a trade entry level.
Volume Profile Indicator Trading Strategy
Generally, there are many ways to trade financial assets using the volume profile indicator. So, in this section, we are going to show a highly effective trading strategy using the VPVR indicator with Fibonacci retracement levels.
Here are the steps you should take to utilize this strategy:
Trading the Volume Profile Indicator with Fibonacci Retracement Levels
Volume indicators work best when combined with other indicators, particularly with Fibonacci retracement levels. Because Fibonacci support and resistance levels are widely used by many traders, these price levels can help you find reliable trade signals once you notice a high volume point at a crucial Fibonacci level.
Here’s what you need to do to trade the VPVR indicator with the Fibonacci retracement tool:
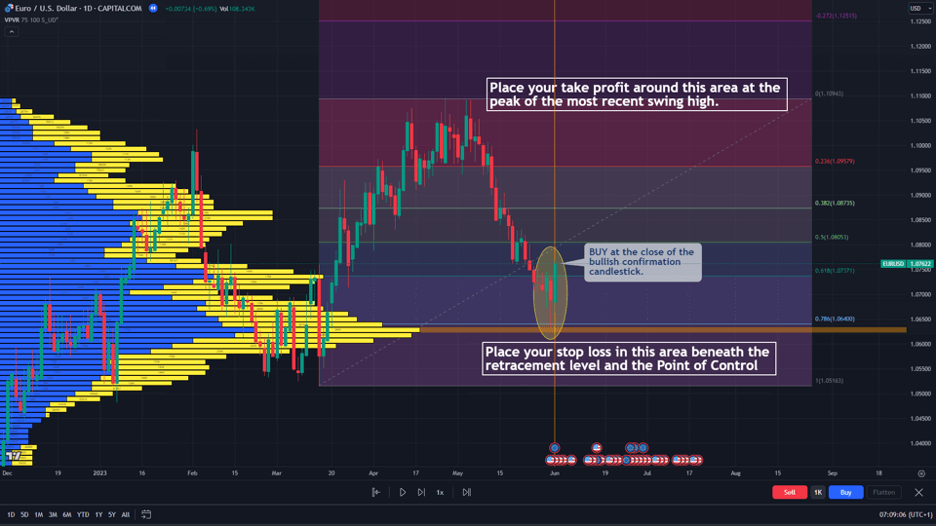
1. First, observe the prevailing trend of the market. In the chart below, for instance, the prevailing trend is bullish.

2. Draw your Fibonacci retracement levels from the most recent swing low to the most recent swing high.
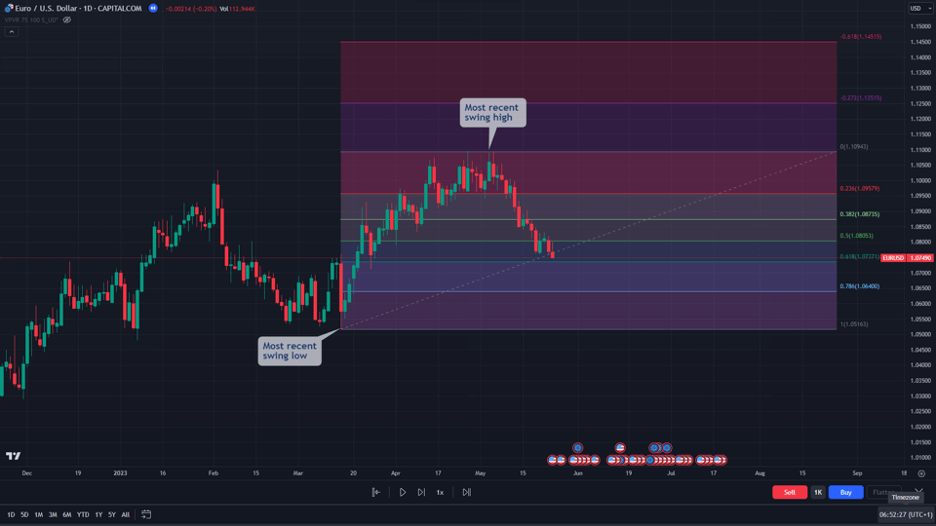
3. Attach your volume profile indicator so that most of the candlesticks so far have been accounted for. This way, you’ll be able to get as much information regarding the traded volume over the past price movements.
4. If your Point of Control coincides with any of the Fib levels, and the price retraces to that level, prepare for a strong buy or sell signal (as shown in the EUR/USD daily chart below).
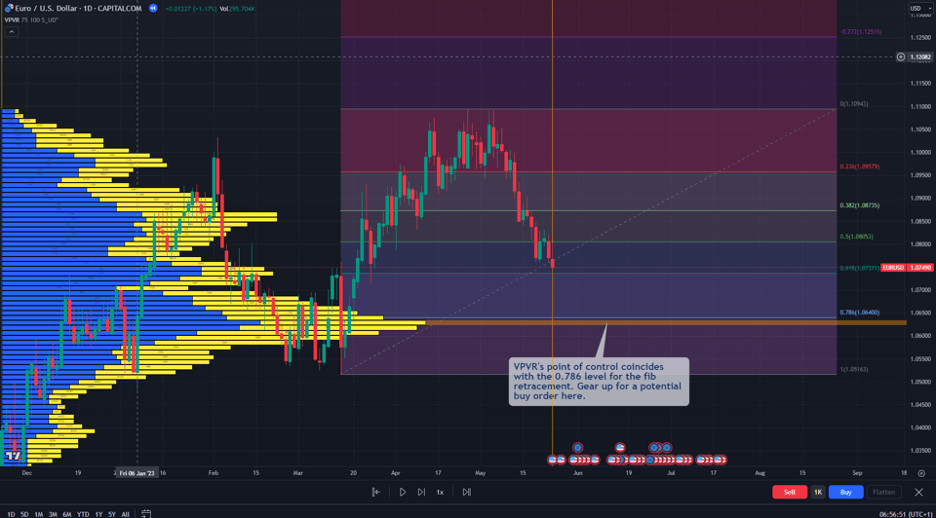
5. Don’t place a trade until you recognize that the pullback or retracement is complete. Then, wait for a candlestick confirmation.
6. As soon as you get a confirmation, open your trade. Place your stop loss beneath your fib level, which is also your Point of Control. Take your profit at any area around your most recent swing high.
Overall, this is what your trade should look like at the end of the day.
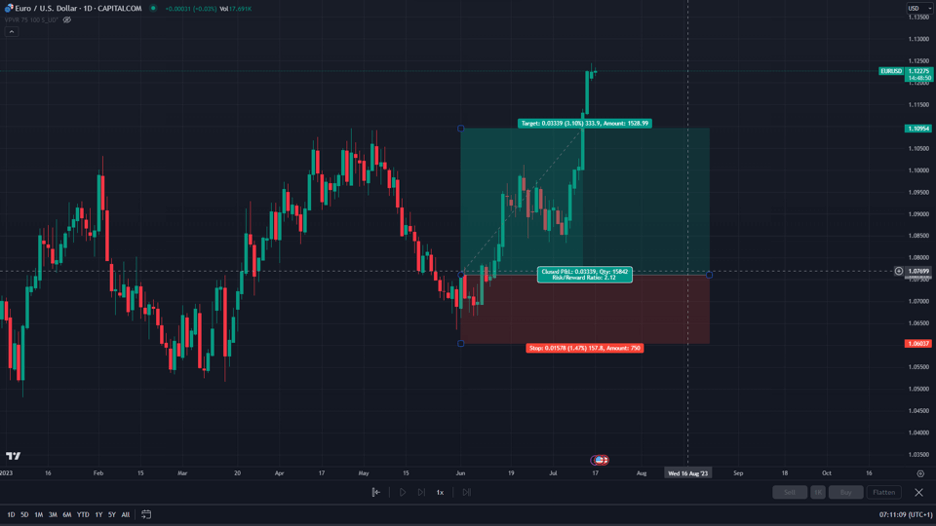
As you can see, the volume profile indicator can certainly help you to find good trade-entry levels. As you can identify crucial support and resistance levels using the Fibonacci retracement tool and identify high trading activity around a certain level using the Volume Profile indicator can assist you in finding reliable and accurate trading signals.
What are the Benefits and Limitations of the Volume Profile Indicator?
Here are some of the advantages and disadvantages of having the VPVR indicator on your chart.
Benefits of Using the Volume Profile Indicator
The Volume Profile Indicator has many things going for it. One of them is that it accurately portrays the volume of market activity going on in a market. This information is important because it helps traders determine the best price levels to buy and sell at.
Another advantage of the Volume Profile indicator is that it is highly customizable. The VPVR shows the volume profile based on the chart’s visible period. If you want more or less data, simply adjust the number of visible candlesticks on your chart.
Here’s a breakdown of the pros of using the VPVR indicator:
Pros
- The volume profile indicator helps traders identify the best prices to buy or sell at
- It also helps traders identify key support and resistance levels on the chart, particularly when combined with the Fibonacci retracement tool
- The VPVR automatically adapts to your visible chart, making it easy to use
- It can be a great trade management tool, allowing you to determine where your stop loss and take profit levels should be
Limitations of the Volume Profile Indicator
The volume profile indicator, just like any other indicator, is not without limitations. However, these limitations are not so many with the VPVR.
Having said that, one of the few limitations of the indicator is that it may take novice traders some time to get used to it because of its adaptability to the currently visible chart.
Here’s a breakdown of the cons of using the VPVR indicator:
Cons
- It takes some time to get used to the VPVR indicator, as shifting your chart carelessly can cause the VPVR to generate new bars
- You may need to constantly hide the VPVR so that you can get a good view of your candlesticks
What are the Differences Between the VPVR, Session Volume Profile, and the Candlestick Volume Profile indicators?
These three indicators help traders identify areas of high and low trading activity, which can signal potential support, resistance, or market interest. However, they have some differences that set one apart from the others.
| Feature | VPVR | Session Volume Profile | Candlestick Volume Profile |
|---|---|---|---|
| Scope | Visible chart range (dynamic) | Fixed trading session (e.g., daily) | Per candlestick (e.g., 1m, 5m) |
| Usage | Quick overview of volume in current view | Quick overview of volume in the current view | Detailed, short-term volume analysis |
| Display | Single histogram for visible range | Analysis of volume during a specific session | Histogram for the entire session |
VPVR shows the volume distribution across the price levels currently visible on a trader’s chart, dynamically updating as the chart is scrolled or zoomed. This makes it ideal for traders seeking a quick overview of volume activity within their current view, without considering broader historical data.
The Session Volume Profile, on the other hand, focuses on volume distribution within a specific trading session, such as a single day, and remains fixed to that session’s duration. It is valuable for analyzing trading activity during market opens, closes, or other session-specific periods, revealing where volume was concentrated.
The third indicator, Candlestick Volume Profile, offers a more granular view of the chart by detailing volume distribution within each individual candlestick, such as a daily or hourly timeframe.
Another major difference lies in their areas of strength. The VPVR highlights key areas like the Point of Control (POC), the price with the highest volume, helping traders identify significant price levels within the visible range. The Session Volume Profile, though, helps day traders identify potential support or resistance levels based on session-specific volume patterns. And the Candlestick Volume Profile is perfect for short-term analysis, like scalping, where understanding volume at specific price levels within a candlestick can reveal buying or selling pressure.
Key Takeaways
- The Volume Profile indicator measures the trading activity of each price level on a given trading instrument and on a given timeframe.
- It is a great tool for drawing dynamic supports and resistances, predicting weakening trends, and also setting stop loss and take profit targets.
- Despite its usefulness, you shouldn’t use it alone. It is best used with other indicators or trading tools.
- To generate reliable trading signals from it, you may need to combine it with tools like the Fibonacci retracement or the MACD.
Frequently Asked Questions About the Volume Profile Indicator
Here are answers to some of the most frequently asked questions about the Volume Profile Indicator:
Do professional traders use the Volume Profile indicator?
Many professional traders rely on the Volume profile indicator a lot. It helps them to know the areas of high trading activity on the chart. It is what they do with this information that marks them out as professional traders. For instance, some use the indicator to denote dynamic support and resistance levels. You’ll also find those that use it as a trade management tool.
Is the Volume Profile indicator accurate?
The Volume Profile Indicator is accurate enough to determine the areas of high trading activity on the chart. However, don’t expect to generate trading signals off of it alone. You may need to rely on more active trading indicators or tools.
How to get the Volume Profile indicator on MT4/MT5?
You can download the Volume Profile indicator from most websites that offer Metatrader indicators. Once you download it, you can then add it manually to your MT4 trading platform.
Risk Disclosure: The information provided in this article is not intended to give financial advice, recommend investments, guarantee profits, or shield you from losses. Our content is only for informational purposes and to help you understand the risks and complexity of these markets by providing objective analysis. Before trading, carefully consider your experience, financial goals, and risk tolerance. Trading involves significant potential for financial loss and isn't suitable for everyone.


