


The Directional Movement Index (DMI) indicator measures trend strength and dynamics, offering traders valuable insights into price movements. It can be used to present a holistic view of trends across diverse asset classes and aid in decision-making.
- The DMI is a powerful tool for traders, offering insights into trends and strengths in financial markets.
- The DMI combines the Positive Directional Indicator (DI+), Negative Directional Indicator (DI-), and the Average Directional Movement Index (ADX) to provide a holistic view of market dynamics.
- Benefits of using the DMI include trend identification and its applicability across various asset classes and timeframes.
In this guide, we are going to cover everything you need to know about the Directional Movement indicator, including how to use the indicator and implement the DMI trading strategy.
- What is the Directional Movement Index (DMI) Indicator?
- How Does the Directional Movement Index (DMI) Indicator Work?
- How to Use The Directional Movement Index (DMI) Indicator in Trading
- Directional Movement Index (DMI) Indicator Trading Strategy Example
- Benefits and Limitations of the Directional Movement Index (DMI) Indicator
- Key Takeaways
- Frequently Asked Questions
What is the Directional Movement Index (DMI) Indicator?
Developed by Welles Wilder in 1978, which primarily focused on commodities trading, the Directional Movement Index (DMI) indicator has since found its way into various markets due to its effectiveness in gauging trends.
This Indicator measures an asset’s price trend, making it an invaluable tool for traders seeking to identify potential opportunities in the market. One of the key distinctions of the DMI is its ability to determine not only the direction in which an asset’s price is moving but also the strength of that price movement.
To incorporate the technical indicator into your trading strategy, you must first understand its display. Unlike some indicators overlaid on the main price chart, the DMI is showcased as a sub-chart, distinctly separated from the primary price movement. This separation allows traders to focus specifically on the trend-related insights provided by the DMI indicator without cluttering their main chart with additional information.
Key levels play a significant role in interpreting the DMI. Two vital levels to keep in mind are 20 and 25. When the Average Directional Index (ADX), a component of the DMI, falls below the 20 mark, it often indicates a weak trend, where the price might be consolidating rather than exhibiting a strong directional movement.
Conversely, an ADX line surpassing the 25 threshold signifies a robust price trend, where the price is likely moving with substantial force in a particular direction.
How Does the Directional Movement Index Indicator Work?
Here’s how to calculate the DMI formula:
1. Calculate the True Range, +DI, and –DI for each period as follows:
True Range: Determine the maximum of three values:
- Current High minus Current Low
- The absolute value of the Current High minus the Previous Close
- The absolute value of the Current Low minus the Previous Close
+DI: If the Current High minus the Previous High is greater than the Previous Low minus the Current Low, then set +DI as the greater of the Current High minus the Previous High or 0.
-DI: If the Previous Low minus Current Low is greater than the Current High minus Previous High, then set -DI as the greater of Previous Low minus Current Low or 0.
- If both +DI and -DI are negative, set both to 0.
- If both +DI and -DI are positive, and +DI is greater than -DI, set +DI as the Current High minus the Previous High and -DI as 0. Otherwise, if +DI is less than -DI, set +DI to 0 and -DI to Previous Low minus Current Low.
2. Smooth the True Range, +DI, and -DI using Wilder’s smoothing technique.
3. Divide the smoothed +DI by the smoothed True Range and multiply by 100 to obtain the +DI plotted for the specified period.
4. Divide the smoothed -DI by the smoothed True Range and multiply by 100 to obtain the -DI plotted for the specified period.
5. Next, calculate the Directional Movement Index (DX) using the formula:
DX= [(smoothed +DI+smoothed -DI)/(∣smoothed +DI−smoothed -DI∣)] ×100
6. Finally, compute the Average Directional Index (ADX):
- For the first value of ADX, calculate the average of DX over the specified period.
- For subsequent ADX values, apply smoothing:
- Multiply the previous ADX value by the specified period minus 1.
- Add the current DX value to the result.
- Divide this total by the specified period.
This comprehensive sequence of calculations and smoothing techniques enables traders to derive the DMI and the subsequent ADX.
How to Use the Directional Movement Index Indicator in Trading
As mentioned, when the Average Directional Index (ADX) is below the 20 mark, it indicates a potential weak trend, often signifying a period of price consolidation rather than robust directional movement. Conversely, when the ADX is above the 25 level, it marks a strong trend where the price is making significant strides in a particular direction.
But more importantly, the real magic of the DMI comes to light through the synergy of its directional positive and negative movement indicators (DI+ and DI-) and the ADX. Much like the double moving average crossover strategy, when the positive directional movement line (DI+ line) crosses above the negative directional movement line (DI- line), accompanied by an ADX above 25 and on the rise, a potential buy signal is created.
This confluence of factors suggests a strong trend is likely underway. Conversely, if the DI+ line crosses below the DI- line while the ADX remains above 25 and continues to rise, a potential sell signal comes into play.
A cardinal rule in interpreting DMI trade signals is to ensure the ADX is perched above the 25 mark. This level signifies that the market is genuinely trending, enhancing the accuracy of the buy or sell signals generated by the DI+ and DI- crossovers.
It’s worth noting that trading decisions based on the DMI should be cautiously approached in non-trending or low ADX scenarios as the potential for false signals increases.
Directional Movement Index Indicator Trading Strategy Example
Now that we’ve covered the basics of the DMI, let’s learn how to trade financial instruments using the indicator:
Trading Strategy Setup
To effectively trade trends, it’s crucial to not only identify the beginning of a trend but also seize opportunities after trend retracements.
The integration of the Fibonacci retracement tool and the DMI forms the cornerstone of our setup. The Fibonacci retracement tool aids in determining the conclusion of price retracements, while this technical indicator provides insights into trend direction and strength. Therefore, this combination can increase the accuracy of trading signals and identify reliable trading opportunities.
Entry Level
To get into a trade, price retracement should have occurred to one of the key Fibonacci retracement levels. Concurrently, the Directional Indicator Plus (DI+) and Directional Indicator Minus (DI-) should have crossed in alignment with the trend’s direction.
The ADX must exhibit a reading above the 25 levels, signifying a robust trend, and should be rising. This combination of conditions is a powerful filter, allowing traders to enter trades when all factors align harmoniously.
Here’s how you should identify a correct entry level upon using the DMI indicator and Fibonacci retracement levels:
1. To grasp the practical application of this strategy, let’s consider the sell setup above. The first thing you want to do is to draw your Fibonacci retracement from the swing high to the swing low.

Note that the asset pulled back to the 61.8% Fibonacci retracement level, indicating that the retracement is ending.
2. You’ll also notice that the DI+ has crossed below the DI-, indicating a potential downward trend. This crossover aligns seamlessly with the asset’s price retracement, setting the stage for a potential sell position.
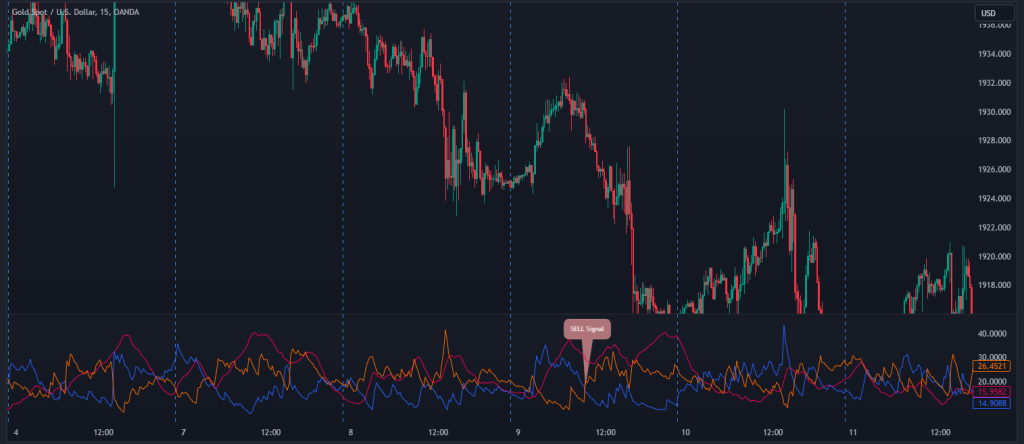
Furthermore, the ADX registers a value above 25, and it continues to rise, reinforcing the notion of a substantial downtrend. This confluence of indicators and levels is a compelling signal to enter a short-sell position.
Stop Loss and Take Profit
1. A robust trading strategy extends beyond mere entry and exit points; it encompasses risk management to safeguard capital. In this regard, the “Extreme Price Rule” proves invaluable.

As the DI+ and DI- crossover occurs, the high or low of that particular day becomes the reference point for setting the stop-loss level, depending on the trend. This approach hedges against unexpected market volatility and ensures risk remains controlled.
2. When taking profits, the swing low (for downtrends) becomes the target. This price level is strategically chosen to capture potential price movements in the direction of the trend.

Benefits and Limitations of the Directional Movement Index Indicator
The DMI brings both advantages and considerations to the table. Here are the most important ones:
Benefits of Using the DMI Indicator
One of the most significant strengths of the DMI is its ability to identify trends effectively. Combining the DI+ and DI- offers traders insights into upward and downward price movements, providing a comprehensive view of market trends, and their strength.
Unlike many other indicators focusing solely on trend direction, the DMI stands out with its dual functionality. This means that traders not only gain insights into price trend direction but also gauge the strength of that trend through the ADX.
Pros
- The DMI is a great trend identification tool
- The ADX provides an extra confirmation and enables traders to evaluate the strength of market trend
- When used with other tools such as Fibonacci Retracement levels, the DMI can be proven as a highly accurate indicator
Limitations of the DMI Indicator
One of the limitations of the DMI stems from its reliance on historical price data. This can result in delayed signals, potentially causing traders to miss out on rapid price movements that occur in real-time.
Moreover, in a market that’s moving sideways, the DMI can produce fake signals due to frequent DI crossovers. This phenomenon, known as the whipsaw effect, can lead to traders entering and exiting positions prematurely, resulting in losses.
Cons
- The signal are often delayed
- It sometimes has a whipsaw effect
- It can be complex for novice traders to understand
Key Takeaways
- The DMI offers traders valuable insights into market trends and their intensity. Its integration of the DI+ and DI- provides a comprehensive understanding of both upward and downward price movements, enhancing decision-making.
- The DMI’s prowess is bolstered by the ADX, a confirmation component that validates whether a market is truly trending. This confirmation step significantly refines trading decisions, reducing the likelihood of entering positions in uncertain market conditions.
- The DMI strategy goes beyond entry points, encompassing robust risk management techniques. Utilizing the “Extreme Price Rule,” traders set stop-loss levels based on the highest or lowest price of the day during DI crossovers.
Frequently Asked Questions About Trading the DMI Indicator
Here are some of the most common questions about the DMI:
What does the DMI indicator tell you?
The Directional Movement Index (DMI) indicator provides insights into trend dynamics and strength in financial markets. As such, it helps traders identify whether an asset is trending and gauges the intensity of that trend.
What is the best indicator to use with the DMI indicator?
There’s no perfect answer for this. However, many traders use indicators such as Bollinger Bands, Moving Averages, and MACD as extra confirmation for their entries.
Is the DMI indicator available on MetaTrader4/5?
Yes, the DMI is available on MetaTrader 4 (MT4) and MetaTrader 5 (MT5) trading platforms. However, it does not come prebuilt in these platforms, along with various other popular trading platforms. This means you must download the indicator on a third-party marketplace and manually add it to your MT4/5 platform.
Risk Disclosure: The information provided in this article is not intended to give financial advice, recommend investments, guarantee profits, or shield you from losses. Our content is only for informational purposes and to help you understand the risks and complexity of these markets by providing objective analysis. Before trading, carefully consider your experience, financial goals, and risk tolerance. Trading involves significant potential for financial loss and isn't suitable for everyone.
