The Relative Strength Index is a popular technical analysis indicator used for generating trading signals and finding profitable trades. It is one of the first go-to indicators for short-term traders, mainly because it is simple to use and available on every trading platform and charting software.
Usually, the RSI indicator’s reading and the asset’s price should be correlated, which means that if the asset price rises, the RSI value will rise as well, and vice versa. But if that is not happening, then we have a classic case of divergence. And a divergence in trading is a trading opportunity.
So, in this article, we’ll help you understand how to use the RSI technical indicator and how to take advantage of RSI’s regular and hidden divergences to find profitable trades. We’ll also share an RSI divergence cheat sheet, so you can use it to trade divergences whenever spotted in the markets. Let’s start.
RSI Divergence Cheat Sheet Download (PDF File)
Here you can go with the quick RSI divergence cheat sheet PDF download, which will help you to know more about this trading strategy, and how to use it correctly:
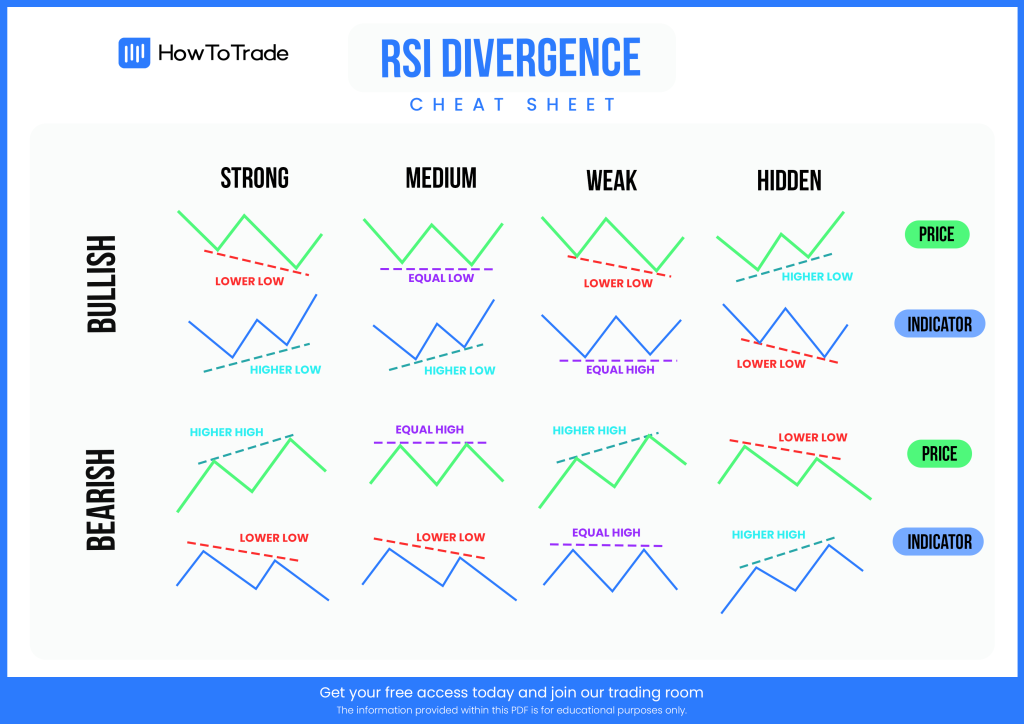
RSI Divergence Cheat Sheet PDF [Download]
What is the RSI Indicator and Why Is It So Popular?
Developed in 1978 by J. Welles Wilder, the Relative Strength Index (RSI) is a momentum oscillator indicator that measures the speed and price changes movements. Traders use it to determine whether the asset is overbought or oversold. According to the indicator’s values, when the RSI rises above 70, then the asset is presumably in an overdemand situation, while when it falls below 30, there’s an oversupply in the market.
However, some people believe that these values are only partially accurate. Based on another theory, you buy the asset when it hovers around 70 and sell it when it touches 80. On the other hand, you short-sell the asset when the RSI is around 30 and buy the asset when it touches 20. This is known as the RSI 80/20 rule.
Either way, the Relative Strength Index is perhaps the most popular technical indicator in technical analysis due to several reasons. At first, it is very simple to use. Traders can find the RSI indicator on any platform or charting software and add it as a sub-chart. Secondly, the RSI provides clear trading signals, particularly for short-term traders and those who use chart patterns to find trading signals. Typically, when the indicator value is between 70-80 or 20-30, you can expect a reversal or at least a price correction. Simple as that.
Here’s what the RSI looks like on a crude oil 1H price chart:

Of course, you’ll have to find your way using the RSI indicator. But unlike other technical analysis indicators, the RSI has no negative impact on a trader’s decision-making process. Instead, you use it as an extra confluence trading tool to make decisions and figure out the strength or weakness of a trend. In that aspect, some say that the RSI is most effective in trading a range, meaning buying the asset at a support level and selling it at a resistance level. Then, you can use the RSI to know the best time to enter and exit a position.
What is RSI Divergence?
As we mentioned, the RSI should be correlated with asset price changes. It means that when the asset’s price rises, the RSI increases, and when the asset’s price falls, so does the indicator’s value. When this is not the case, a divergence occurs. An RSI divergence occurs when the asset’s price moves in the opposite direction of the RSI indicator. And guess what? Traders use divergences to make a trade.
Practically, because the RSI is a sub-chart placed below the main chart, it is pretty easy to spot RSI divergences. When you trade divergence, you try to find these situations when the price of the asset moves in one direction and the RSI indicator in the other direction. Then, based on the signal you receive from the indicator’s divergence, you enter or exit a position.
Note that there are two types of RSI divergence – bullish and bearish. Now, there are also different levels or formations for each kind of divergence. Those include the regular, hidden, and exaggerated.
Bullish Divergence RSI
A regular bullish divergence RSI occurs when the RSI indicator shows higher highs while the asset’s price forms lower lows. If this happens, the RSI signals that price action is about to reverse, and a bullish trend or price correction can occur.
The hidden bullish divergence occurs when the asset’s price makes higher lows while the RSI indicator forms lower lows. Once again, when this happens, hidden bullish divergences signal that the price is likely to pause before continuing in the same direction.
Bearish Divergence RSI
A regular bearish RSI divergence occurs when the RSI indicator shows lower lows while the asset’s price forms higher highs. When this happens, the RSI regular bearish divergence signals the possibility of a trend reversal, and a bearish trend or price correction is very likely to occur.
The hidden bearish divergence occurs when the asset’s price makes lower highs while the RSI indicator forms higher highs. In such a case, the RSI hidden divergence signals that the price is likely to correct or pause before the existing trend continues.
As RSI Divergence is often used together with the Moving Average Convergence Divergence (MACD), you can check our MACD Divergence cheat sheet to get to know more about their relation.
Summary
In summary, the RSI divergence is a very simple yet effective trading technique, enabling traders to find reliable trading signals. If you are going to integrate the RSI indicator into your trading setup, you can use the RSI indicator to find buy and sell trading signals.
But that is not the only use of the Relative Strength Index indicator. In addition, by learning how to use divergence trading, you can also use the RSI divergence as an extra technique to find successful trades.
So, to get another handy trading tool, download our RSI divergence cheat sheet. Additionally, we suggest you also read our divergence guide and download our divergence trading cheat sheet that includes other indicators such as Stochastic Oscillator, Bollinger Bands, and CCI.
Risk Disclosure: The information provided in this article is not intended to give financial advice, recommend investments, guarantee profits, or shield you from losses. Our content is only for informational purposes and to help you understand the risks and complexity of these markets by providing objective analysis. Before trading, carefully consider your experience, financial goals, and risk tolerance. Trading involves significant potential for financial loss and isn't suitable for everyone.