The XABCD is a harmonic chart pattern used by traders to predict the end of an existing trend and the beginning of a new one. Combined with Fibonacci retracement levels, XABCD chart patterns are considered among the most powerful patterns in technical analysis.
In this article, we’ll explain what XABCD harmonic patterns are, show you the different types, and help you find ways to identify and use these patterns in your forex trading.
- What is the XABCD Candlestick Pattern?
- What are the Major XABCD Pattern Types?
- How to Identify the XABCD Pattern in Trading?
- How to Trade the XABCD Pattern (in 3 Easy Steps)?
- What are the Benefits and the Limitations of the XABCD Pattern?
- How Reliable and Accurate are XABCD Harmonic Patterns?
- How Do You Use an XABCD Pattern?
- Which Timeframe is Best for Trading XABCD Harmonic Patterns?
- Key Takeaways
What is the XABCD Chart Pattern?
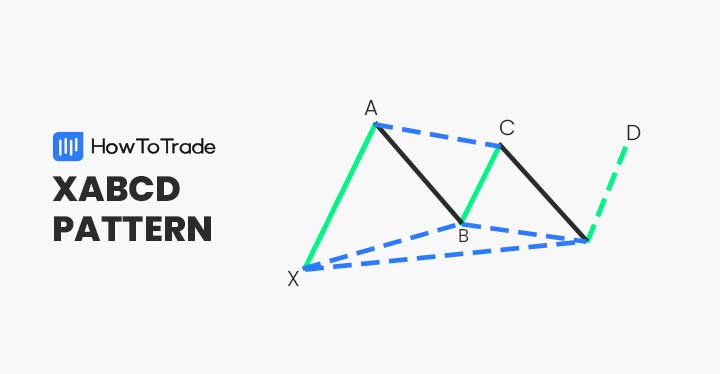
Developed by Harold McKinley Gartley, the XABCD is a trend reversal pattern with five separate points (XABCD) and four legs (XA, AB, BC, and CD). The pattern can be a bullish pattern or a bearish pattern, and, in any matter, it indicates that the price action is about to reverse.
The Five Points (X, A, B, C, D)
- Point X: This is the starting point of the pattern, marked by a significant swing high (for a bearish pattern) or swing low (for a bullish pattern).
- Point A: Point A represents a retracement of the initial move (XA) by a specific Fibonacci level, typically 38.2% or 50%.
- Point B: This point marks a new swing high/low that surpasses point X.
- Point C: Point C represents a retracement of the move from B to A (AB) by a Fibonacci level, typically between 61.8% and 78.6%. It’s considered the potential reversal or continuation point.
The Four Legs (XA, AB, BC, CD)
These legs connect the five points and represent the price movements between them. Understanding the ideal Fibonacci ratios between these legs is essential for identifying different variations of the XABCD pattern.
What are the Major XABCD Pattern Types?
The XABCD is the base of all other harmonic patterns in technical analysis. There are four major XABCD patterns, depending on the ratio of one point to another. Each pattern has similar formations and rules.
- The Gartley chart pattern
- The Butterfly chart pattern
- The Crab chart pattern
- The Bat chart pattern
Let’s delve into a little more detail about them:
1. Gartley Pattern: Considered the most common and reliable XABCD pattern. It has strict Fibonacci retracement ratios for each leg, with specific zones for XA, AB, BC, and CD.
2. Butterfly Pattern: Similar to the Gartley pattern but with slightly looser Fibonacci retracement ranges. It’s known for its wing-like structure on the chart.
3. Crab Pattern: The most complex of the four patterns. It has a deeper retracement for leg BC (often exceeding 61.8% of AB) and a shorter leg CD compared to other variations.
4. Bat Pattern: Known for its shorter retracements on both legs BC and CD compared to other XABCD patterns. It has a somewhat less strict range of Fibonacci ratios.
The table below shows what these specific ratios are going to look like for each type:
| Pattern | Gartley | Butterfly | Crab | Bat |
| AB/XA ratio | 61.8% | 78.6% | 38.2% or 61.8% | 38.2% or 50% |
| BC/AB ratio | 38.2% or 88.6% | 38.2% or 88.6% | 38.2% or 88.6% | 38.2% or 88.6% |
| CD/BC ratio | 127.2% or 161.8% | 161.8% or 261.8% | 224% or 361.8% | 161.8% or 261.8% |
| CD/XA ratio | 78.6% | 127% or 161.2% | 161.8% | 88.6% |
It is important to note that these Fibonacci ratios are for the ideal scenarios, but you’ll hardly find ideal scenarios on the chart. What you’ll often find is a wide variation from these ideal scenarios. So, be ready to work with whatever you have.
How to Identify the XABCD Pattern in Trading?
One of the flaws of XABCD chart patterns is that they’re not easy to spot and identify, especially for beginners. As mentioned, the XABCD pattern is based on the Fibonacci sequence and ratios. There are specific ratios for the XABCD pattern, which makes it very hard to remember the numbers and absorb this information.
1. Look for M’s and W’s
The XABCD pattern is tricky to spot. But to make things easy for you, look for M’s and W’s on your chart. These are potential XABCD patterns. If the pattern is bullish, then the shape of the letter M is formed. For a bearish XABCD pattern, you’ll notice a formation of the letter W.
You can see what a bullish XABCD carb pattern looks like in the chart below.
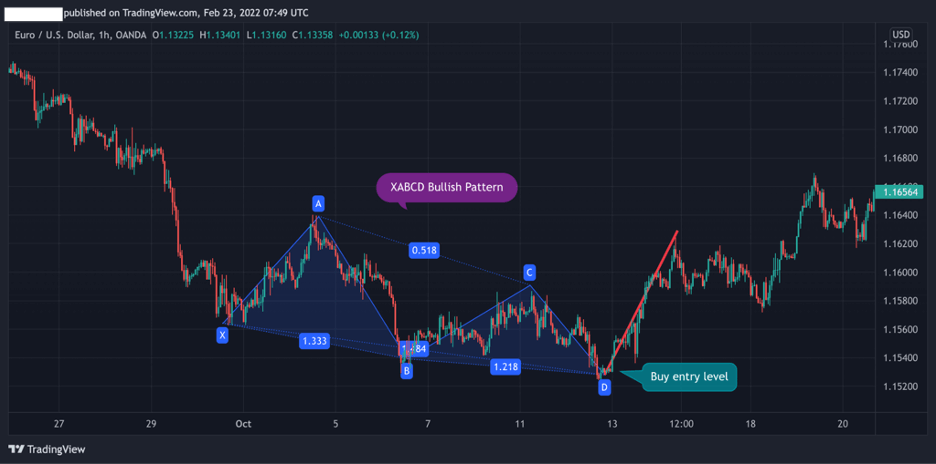
The image above is a perfect example of identifying potential XABCD patterns on your chart by simply looking out for M’s and Ws.
2. Using Indicators
Indicators are a great way of scouting XABCD patterns on the chart. However, because of the complexity of the pattern, you’ll often find the indicator providers charging for the tools. However, there’s a free XABCD pattern indicator on TradingView, XABCD Harmonic Pattern Custom Range Interactive. While this indicator will not automatically mark out the pattern on your chart, it can help tell you if an XABCD pattern you’ve marked out is invalid. It will also predict potential entry point and risk management rules based on the pattern.
3. Using Harmonic Scanners
One way to identify XABCD patterns is to use harmonic scanners, although you’ll have to pay a fee for using this service. Otherwise, if you insist on finding an XABCD pattern on your own, you need to identify the pattern and use the XABCD built-in indicator on your trading platform (the XABCD harmonic pattern indicator is available on MetaTrader4).
How to Trade the XABCD Pattern (in 3 Easy Steps)
The XABCD patterns can work at any time frame and on any instrument. However, drawing the pattern manually in a trading chart is almost impossible as each pattern has many ratios. Luckily, most charting platforms these days allow you to add the pattern automatically as a built-in indicator.
Below, we are going to show you how to draw the XABCD harmonic pattern, find the right entry level, set a stop loss, and take profit targets.
1. Drawing the XABCD Harmonic Pattern
The first step is to draw the XABCD pattern on a price chart. Once you’ve identified the pattern, you can navigate to the indicators menu on your charting software and automatically draw the pattern by stretching the lines from X to A, A to B, B to C, and C to D.
The EUR/USD daily chart below shows how the XABCD bearish Gartley pattern is formed with five points and four legs. Using the software XABCD indicator, we automatically drew the pattern into the chart.
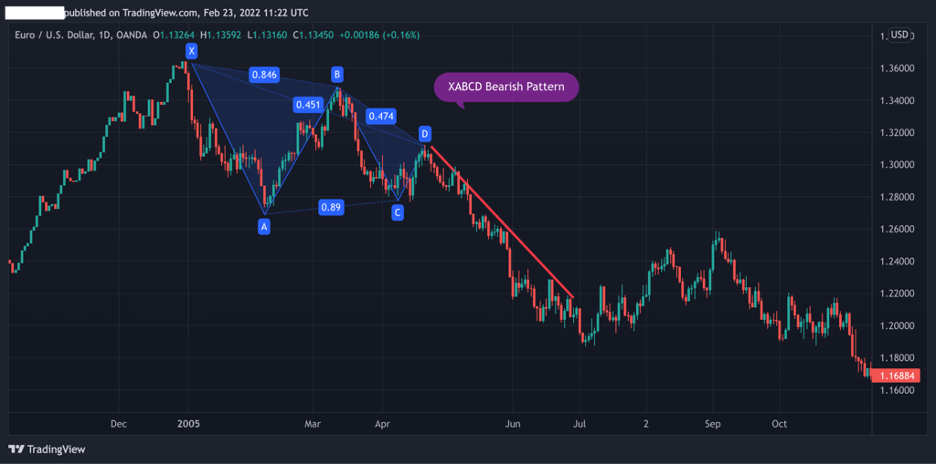
2. Find Entry Level Using Momentum Indicators
One of the good things about XABCD harmonic patterns is that you get a precise entry level, which is the D level. This is the price area where the potential reversal zone occurs, and the trend is about to reverse.
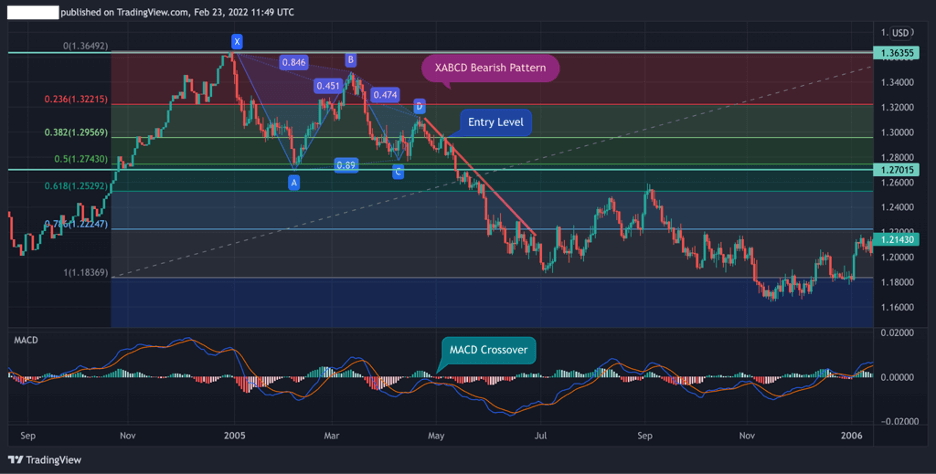
Still, even though this pattern provides a clear entry-level, it’s always best to add other indicators to confirm the reversal. In the chart below, we used the MACD indicator and Fibonacci retracements.
In this case, the ideal entry level for this trade is at the 38.2% Fibonacci level when the MACD crossover occurs.
3. Set a Stop Loss and Take Profit Target
Finally, you need to set a stop-loss order and find the ideal take-profit target. Once again, one of the critical advantages of the XABCD pattern is that it provides a well-defined stop loss and take profit target. In general, stop loss should be located at the X level; however, take note that this applies to the Gartley and Bat patterns only.
For the Butterfly pattern and the Crab pattern, you’ll have to use Fibonacci retracements to locate a stop-loss order.
Take profit is located at the C level, A level, or below (when used with Fibonacci retracements).

As you can see, we placed the stop-loss order at the X point. As for taking a profit – because the C and A levels are relatively close to the entry-level, we used Fibonacci levels from the lowest level of the prior trend to the X level. As seen in the chart, this provides you with several options to place a take-profit order.
What are the Benefits and the Limitations of the XABCD Pattern?
These are the most common pros and cons of trading the XABCD pattern:
Pros
- If used correctly, XABCD patterns are highly accurate
- It can be used in combination with other chart patterns and technical indicators
Cons
- The XABCD harmonic chart pattern is a relatively complicated chart pattern to understand and use
- Stop-loss placement is not well defined on all XABCD harmonic patterns (For example, crab and butterfly)
- May conflict with Fibonacci ratios
How Reliable and Accurate are XABCD Harmonic Patterns?
By using golden geometry shapes, XABCD patterns provide visual formations that often repeat themselves. Clearly, these patterns are not always accurate, and it isn’t easy to learn how to use XABCD patterns in trading. However, suppose you succeed in drawing these patterns correctly; in that case, XABCD patterns are among the most accurate charting patterns in technical analysis (according to some financial experts, these patterns have an accuracy rate of 80%-90%).
How Do You Use an XABCD Pattern?
Like most other chart candlestick patterns, you first need to identify and draw the XABCD pattern on a price chart. However, as we mentioned, it will be a challenge to calculate and draw the XABCD pattern on your own. This obviously takes time and effort, and remembering the details of each pattern is not an easy task. Luckily, these days, you can find many charting platforms that enable you to draw the pattern automatically by using a built-in indicator. Therefore, once you identify one of the XABCD patterns, you simply need to draw the pattern on a trading chart and follow the rules and guidelines we mentioned in this article.
Which Timeframe is Best for Trading XABCD Harmonic Patterns?
Trading XABCD patterns usually works best on medium to long-term time frames. These include a 1-hour chart, 2-hour chart, daily/weekly/monthly chart.
Key Takeaways
To sum up, here are the main points to know about XABCD harmonic patterns:
- The XABCD is the base of harmonic chart patterns with five points and four legs. These five points and four legs connect to form chart patterns
- There are four major XABCD chart patterns – Gartley, Butterfly, Crab, and Bat
- To trade XABCD patterns, you need to draw the pattern on your trading software by using a built-in indicator
- Entry-level should be at the D point. Stop-loss is placed at the X level (for the Gartley and Bat patterns) and take profit at the C, A levels or below at the following Fibonacci levels
Risk Disclosure: The information provided in this article is not intended to give financial advice, recommend investments, guarantee profits, or shield you from losses. Our content is only for informational purposes and to help you understand the risks and complexity of these markets by providing objective analysis. Before trading, carefully consider your experience, financial goals, and risk tolerance. Trading involves significant potential for financial loss and isn't suitable for everyone.