


The harmonic bat pattern is a 5-point chart formation with specific Fibonacci measurements indicating a trend reversal possibility. It was discovered by Scott Carney in 2001 and is one of the four most common and popular harmonic chart patterns.
The bat pattern is known as the most accurate of all harmonic chart patterns; however, using it requires the consideration of a range of factors, including the Fibonacci measurements, entry levels, and profit targets.
- The Bat chart pattern is a harmonic pattern used in technical analysis to identify potential reversal zones in the financial markets.
- Characterized by its distinct ‘bat-like’ structure, this pattern relies on specific Fibonacci ratios to pinpoint entry and exit points.
- Traders utilize the Bat pattern for its high accuracy in forecasting market reversals, especially in forex and stock trading.
This article will show you how to identify and use the bat harmonic candlestick pattern. Then, keep reading to learn how to trade the bat pattern.
- What is the Bat Harmonic Pattern?
- How to Identify the Bat Candle Pattern Trading?
- Bat Harmonic Pattern Trading Strategy
- What are the Benefits and Limitations of the Bat Harmonic Pattern?
- Bat Harmonic Pattern (VIDEO)
- What is the Difference Between the Gartley Harmonic Pattern and the Bat Harmonic Pattern?
- Key Takeaways
- Frequently Asked Questions (FAQs)
What is the Bat Harmonic Pattern?
The bat pattern is a harmonic chart formation with specific Fibonacci measurements that aim to help investors identify the next trend reversal. Essentially, it has a particularly similar formation as the Gartley harmonic pattern, although one key difference between the two harmonic price patterns is the Fibonacci ratios.
Moreover, it has a similar structure to other popular harmonic patterns like the butterfly pattern, crab patterns, and shark harmonic patterns. To see all harmonic patterns, you can download our harmonic patterns cheat sheet here.
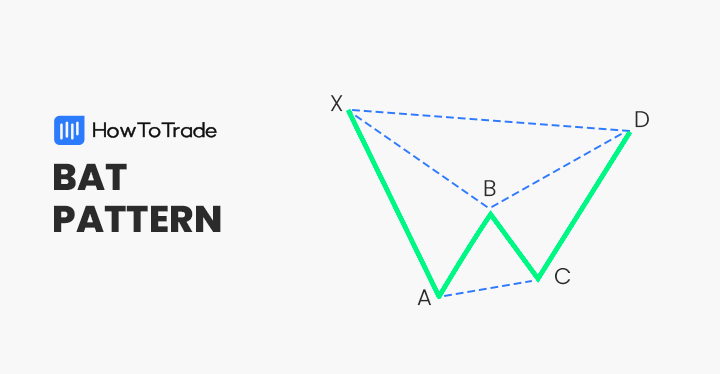
Like most other harmonic patterns, the bat pattern has five points and four price swings. The five points are X, A, B, C, and D, and the price swings are XA, AB, BC, and CD. Ultimately, when the pattern appears in perfect formation, point D is known as the reversal point.
Prices are likely to reverse in this area, known as the potential reversal zone (PRZ). Traders, therefore, use this opportunity to enter a position with a tight stop loss above or below the X level and set a take profit at the A level or higher.
How to Identify and Use the Bat Candle Pattern in Trading?
The most challenging part of using the bat pattern is identifying it. Like other harmonic patterns, the bat pattern is usually used by advanced traders who can already find this formation naturally on trading charts. For beginners, it could be much more challenging to identify the bat pattern.
Yet, it’s not rocket science. If you learn how to identify and use this pattern, you can find many market trading opportunities. The first thing you need to know is the Fibonacci measurements of the bat pattern. Those are:
- AB leg retraces between 38.2% to 50% Fibonacci ratio of XA leg
- The BC leg extends beyond the X point by an 88.6% Fibonacci ratio of the XA leg
- B point retracement is between 38.2% to 50% of XA leg
- The BC price swing is an extension of 161.8%-261.8% to 224% of the XA wave
- The length from X point to D point is 88.6% retracement
- The BC leg is at 161.8%-261.8% of the Fibonacci retracement level of the CD leg
Another vital factor to remember is that you need to draw the bat pattern on trading charts. Although it is theoretically possible to do it manually, you better use a trading platform that automatically draws the bat pattern (or any other harmonic pattern).
One trading platform that offers this feature is MetaTrader4. If you wish to find a bat pattern strategy on an online service, you can also use TradingView, for that matter.
Note that TradingView does not offer a bat pattern drawing tool; however, you can use its XABCD drawing tool and change the ratios to match the bat pattern.
Taking the above into account, let’s see an example of the bat pattern on a price chart.
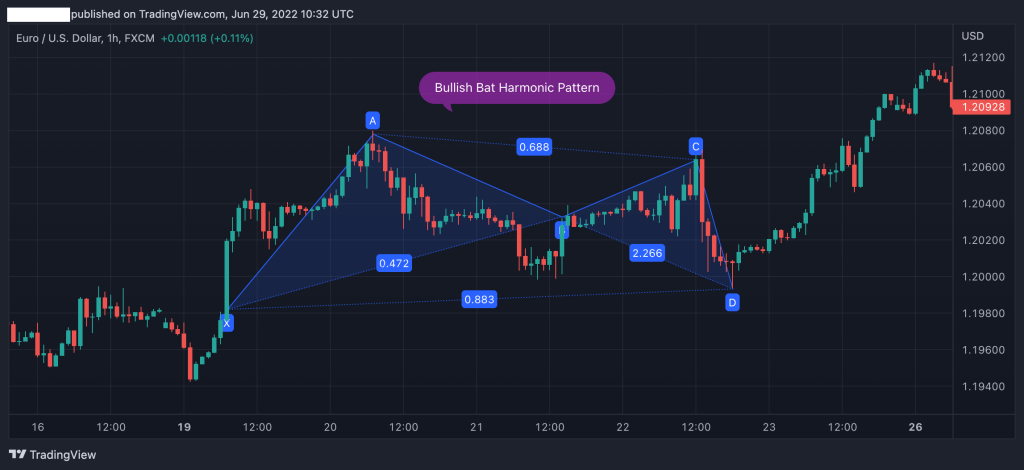
As you can see in the EUR/USD 1H chart above, the bullish bat pattern appears with the ideal bat pattern’s conditions. In this situation, a trader will be looking to enter a position at point D with the expectation that the market is about to reverse from the last price swing (that is, the CD bearish trend).
Bat Harmonic Pattern Trading Strategy (3 Easy Steps)
Trading bat chart patterns require you to understand all the factors that make this harmonic trading strategy profitable.
First, you need to know how to draw bat patterns using a drawing tool on your trading platform. Secondly, you must know when to enter a trade and the level at which you need to set your stop loss and take profit orders.
In this section, we will show you a step-by-step process on how to use and trade the bat harmonic candle pattern.
1. Bat Pattern – Find and Entry Level
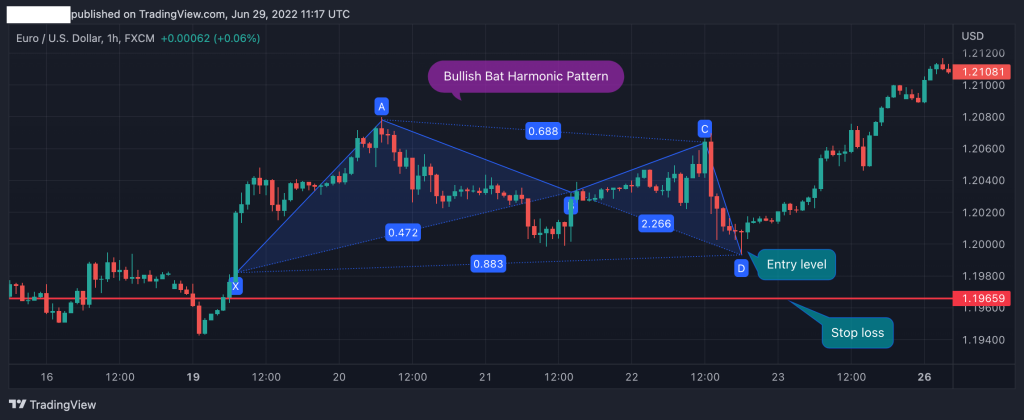
The first step in trading the bat harmonic pattern is to draw the pattern on a price chart and find the ideal entry-level.
As we explained earlier, you can draw the pattern with a built-in drawing available on some trading platforms. Once you identify the bat pattern and it has all the ideal conditions, you can enter a position at point D.
Additionally, it’s better to use other technical analysis tools to confirm the reversal. In the example below, we used the relative strength index and MACD to ensure a trend reversal is likely to occur.

2. Bat Pattern – Set a Stop Loss
The next step is to set a stop loss level. Fortunately, the bat harmonic candlestick pattern provides a well-defined level for stop-loss at point X. If the price breaks below the X level, then the pattern is invalid, and you should exit the position.
3. Bat Pattern – Set a Take Profit Target
Finally, some traders prefer setting a take-profit target when they enter a trade. This helps them ensure they have proper trade risk management and a risk-reward ratio. Luckily, when you trade the harmonic bat pattern, you have a clear first take profit target at level A.

Note that sometimes you might feel the momentum is on your side, and you would like to extend the profit target. If so, you can set the next take profit level at the following Fibonacci support or resistance level using the A point as a support level.
What are the Benefits and Limitations of the Bat Harmonic Pattern?
Let’s check the pros and cons of trading the Bat chart pattern.
Pros
- Accurate chart pattern
- The bat pattern provides clear levels for stop loss and take profit target
- Excellent risk-reward ratio
- Works well for short and long-term traders
Cons
- Not ideal for beginner traders
- The automatic drawing feature is not available on all trading platforms
Everything About the Bat Harmonic Pattern in One Video
For more information, you can check this video by our trading analysts on how to identify and trade the bat harmonic pattern.
What is the Difference Between the Gartley Harmonic Pattern and the Bat Harmonic Pattern?
The Bat pattern and the Gartley pattern have a similar structure, making some people confused about how to differentiate these two patterns. They both are internal and signal a trend reversal at point D.
Nonetheless, the main factors that differentiate the two are the Fibonacci ratios at points B and D. Further, the second difference is the leg D of the bat pattern, which has a more protracted retracement than the Gartley pattern.
- The bat is a harmonic trend reversal pattern that has specific Fibonacci ratios
- The bat pattern has five points and four price swings
- When trading the harmonic bat pattern, traders enter a position at point D
- Stop-loss is placed below (or above for the bearish bat pattern) point X and take profit at point A
Frequently Asked Questions about the Bat Harmonic Pattern
Here are some of the most frequently asked questions about the bat harmonic pattern in forex trading:
How accurate is the harmonic Bat pattern?
The Bat harmonic pattern is considered one of the technical analysis’s most accurate chart patterns. Though it is not guaranteed and is dependent on a range of factors, it has an accuracy rate of around 85%, according to some analysts.
Is the bat pattern bullish or bearish?
A bat harmonic can be either bullish or bearish. This depends on where it appears on a price chart – at the bottom of a downtrend or uptrend. But if it has all the conditions and Fib ratios, it is indeed a harmonic bat pattern.
Risk Disclosure: The information provided in this article is not intended to give financial advice, recommend investments, guarantee profits, or shield you from losses. Our content is only for informational purposes and to help you understand the risks and complexity of these markets by providing objective analysis. Before trading, carefully consider your experience, financial goals, and risk tolerance. Trading involves significant potential for financial loss and isn't suitable for everyone.


