


Are you familiar with the Gartley harmonic pattern? How about Gartley patterns in general? If not, this article will get you up to speed ASAP.
Read on to learn how to recognize, interpret, and trade the Gartley chart pattern.
What is the Gartley Pattern?
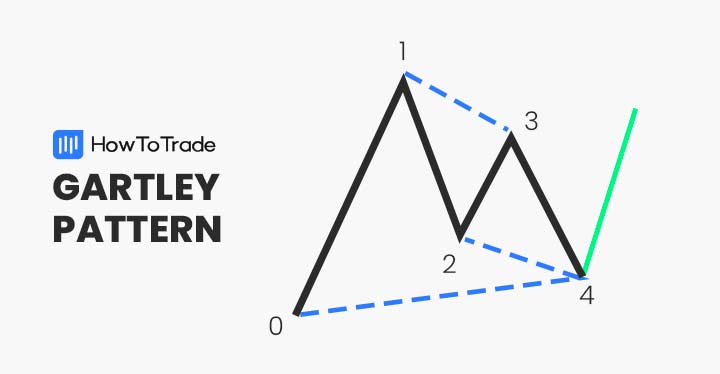
The Gartley pattern is a harmonic chart formation that relies on the Fibonacci sequence for construction. The formation was intended for the stock market but may be applied to any instrument or product.
Gartley patterns are the most commonly used harmonic patterns in technical analysis. They furnish the trader with price targets for taking profits and locating stop losses.
Currency traders use Gartley patterns to project forthcoming bullish and bearish price action in the forex markets. Also, the formation helps study market symmetry when trading forex.
How to Identify the Gartley Pattern in Trading?
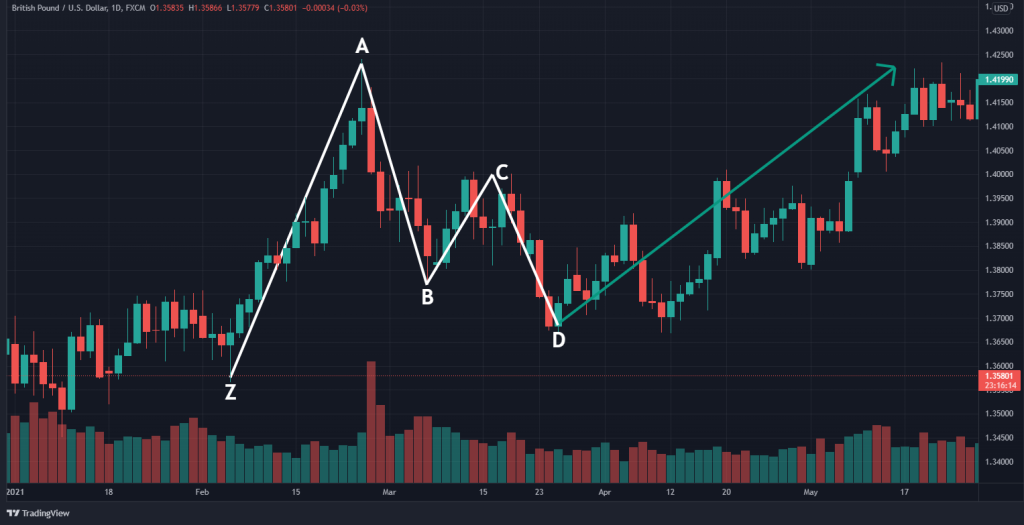
Like other harmonic patterns, the Gartley has many applications in the forex markets. There are two types of this formation: the bullish and bearish Gartley pattern. The GBP/USD chart below gives us a complete illustration of this powerful formation.
Follow the steps below to use the Gartley pattern:
- Identify bullish or bearish market conditions
- Label the series of four peaks and troughs
- Measure the Fibonacci retracements using the point Z to point A move
- Point B should be 61.8% of point A’s high
- Point C should be 38.2% of point A’s high
- Point D should be 78.6% of point A’s high
- Determine a buy (bullish) or sell (bearish) entry from the 78.2% Fibonacci retracement
The Bullish Gartley pattern
In the forex market, the bullish Gartley may be used to identify a buying opportunity. The formation is considered to be a retracement and continuation pattern. It projects the extension of an uptrend.
The bullish Gartley consists of an uptrend in price and a series of measured retracements. The GBP/USD chart below illustrates the Gartley bullish pattern.

The Bearish Gartley pattern
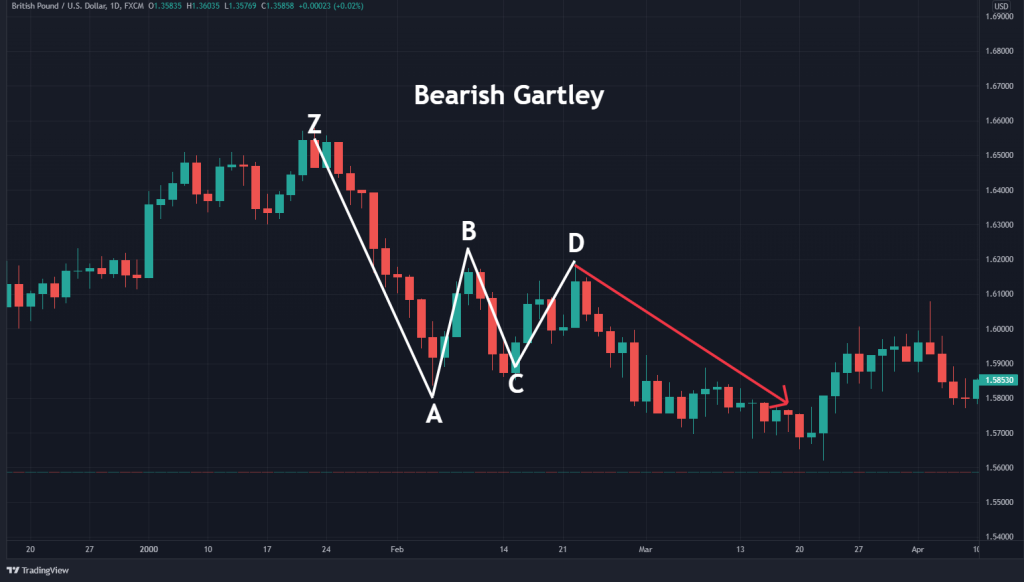
The bearish Gartley is the opposite of the bullish Gartley pattern. It is also considered to be a retracement and continuation pattern. However, instead of being a buy signal, it suggests that a sell may be appropriate.
The bearish Gartley is comprised of a solid downward move in price followed by a series of retracements. The GBP/USD price chart below gives us a clear look at the bearish Gartley.
How to Trade the Gartley Pattern (in 3 Steps)?
As with all forms of technical analysis, there’s a process behind executing a bearish or bullish Gartley trade. It involves building the pattern, determining market entry, and locating stop losses and profit targets.
1. Market Entry
One of the best things about the Gartley formation is that it offers the trader flexibility regarding market entry. The pattern offers both buying and selling opportunities, depending upon market conditions.
Generally, traders choose to buy or sell when the C-D leg has retraced 78.6% of the Z-A directional move. Doing so improves both the timing and profitability of a bullish or bearish trade.
2. Stop Loss
With the Gartley, placing stop losses is relatively straightforward. The stop-loss order is placed below or above the origins of the Z-A leg. This potential reversal zone is targeted as follows:
- For a bullish Gartley, the stop loss is placed beneath the Z-A leg.
- For a bearish Gartley, the stop loss is placed above the Z-A leg.
3. Profit target
Locating profit targets with the Gartley pattern is subjective. However, one popular method uses retracement levels as upside or downside targets.
For instance, in a bullish Gartley, you could draw a Fibonacci retracement from the high point A to the low point D. Profit targets may then be placed at the 61.8% or 78.6% level.
Gartley Pattern Trading Example
Like all chart patterns, the Gartley is traded according to a specific process. The GBP/USD example below gives us a detailed look at how the formation is traded in the live forex.
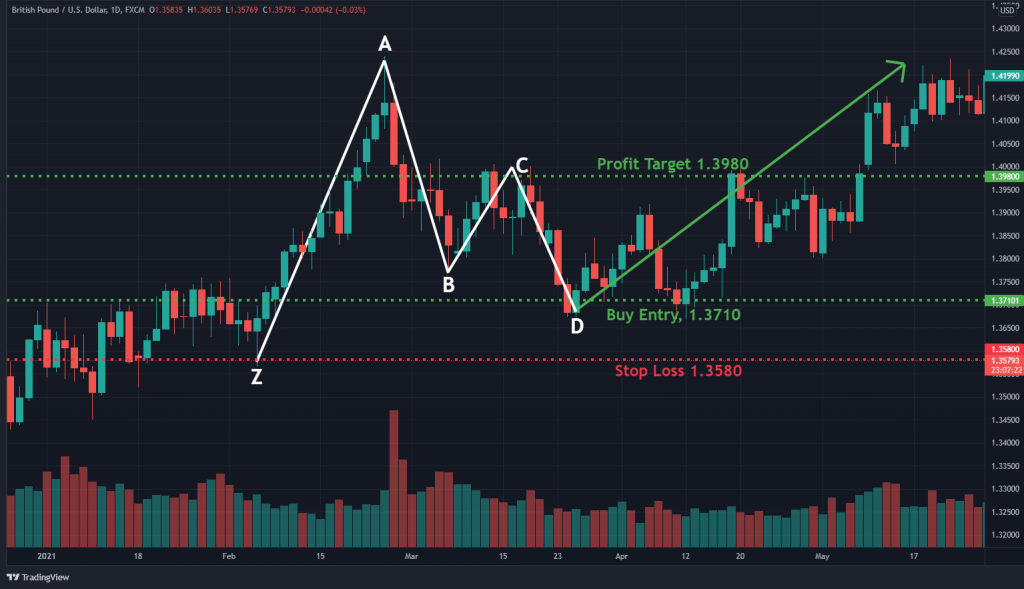
The GBP/USD long trade was executed as follows:
- An uptrend (Z-A) was observed
- Upon the market retracing 61.8% (A-B), rallying (B-C), and then pulling back (C-D), the Gartley was formed.
- A buy order was executed at the 78.6% retracement Z-A, 1.3710
- A stop loss was placed below Z at 1.3580.
- A profit target was located at the 38.6% retracement of Z-A, 1.3980.
- The profit target was hit, producing a 270 pip gain.
The Gartley Pattern – Pros and Cons
All indicators and technical tools have a list of advantages and disadvantages. Below are a few important ones of the Gartley pattern.
Pros
- Occurs frequently
- May be traded in all markets, on all time frames
- Often produce buy/sell signals with exceedingly positive risk vs. reward ratios
Cons
- Can be challenging to identify and construct
- Loses efficacy in consolidating markets
- In many cases, the Gartley produces conflicting signals
Everything About the Gartley Pattern in One Video
Check this video for more information on how to trade the harmonic Gartley chart pattern.
Key Takeaways
Below you can find the key takeaways about trading the Gartley chart pattern.
- The Gartley pattern is a harmonic chart pattern. It suggests a continuation of the prevailing bullish or bearish trend.
- Gartleys consist of four waves: the Z-A, A-B, B-C, and C-D. The Z-A is the initial bullish or bearish move; A-B is a 61.8% retracement of Z-A; B-C exceeds the 38.2% retracement of Z-A; C-D is the 78.6% retracement of Z-A.
- Market entry points are subjective but commonly involve the Z-A wave’s 61.8% or 78.6% Fibonacci retracement.
- Profit targets are also subjective. Stop losses are placed below or above the Z point
Risk Disclosure: The information provided in this article is not intended to give financial advice, recommend investments, guarantee profits, or shield you from losses. Our content is only for informational purposes and to help you understand the risks and complexity of these markets by providing objective analysis. Before trading, carefully consider your experience, financial goals, and risk tolerance. Trading involves significant potential for financial loss and isn't suitable for everyone.


