The butterfly harmonic pattern is a reversal chart pattern that appears at the end of a trend move. It is known as one of the most advanced and complicated harmonic patterns used by forex traders to identify trend reversals.
At the same time, it is also among the most reliable and accurate chart patterns in trading, if used correctly. Here, we are going to show you how to identify, and trade the butterfly patterns in the forex market.
- What is the harmonic butterfly pattern?
- What are the Specific Fibonacci Ratios of the Butterfly Pattern?
- How to identify and use the butterfly pattern in forex trading?
- The Butterfly Pattern Trading Strategies
- What are the Benefits and Limitations of the Harmonic Butterfly Pattern?
- Harmonic Butterfly chart pattern (VIDEO)
- When is the Best Time to Enter a Position When Trading the Butterfly Pattern?
- Key takeaways
- Frequently Asked Questions (FAQs)
What is the Harmonic Butterfly Chart Pattern?
The butterfly chart pattern is part of the harmonic patterns group and works on the same principle of the double bottom and double top-charting patterns. In simple terms, this technical analysis charting pattern, which has a butterfly shape, helps traders find a potential reversal zone following a price consolidation and two descending or ascending peaks.
Much like the double top and double bottom chart patterns, the butterfly chart pattern is composed of four legs with two peaks and two lows or highs (bullish or bearish).
However, unlike double tops and bottoms, the butterfly pattern starts the trend reversal throughout its development and is considered a more accurate indication than many other harmonic patterns.
What are the Specific Fibonacci Ratios of the Butterfly Pattern?
The butterfly pattern has specific Fibonacci ratios that must occur for it to be valid.
Those include:
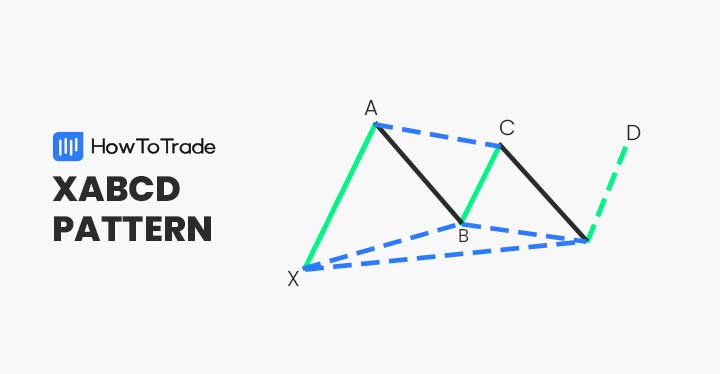
- The AB should retrace back to the 78.6% Fib level of the XA leg.
- The second leg, BC, changes direction and should retrace back between 38.2.0–88.6% from the AB leg.
- The CD leg moves in the opposite direction to the BC leg, with a Fibonacci extension level to the AB leg of 127%-161.8%. When this leg is formed, a butterfly pattern is formed.
How to Identify and Use the Butterfly Pattern in Forex Trading?
To be honest, finding and identifying the butterfly pattern is certainly not an easy task. It requires trading experience and knowledge of other techniques and technical indicators, particularly the Fibonacci retracement levels.
Further, the butterfly pattern resembles in structure and formation the Gartley pattern as well as the Bat pattern, which makes it a complicated reversal trading pattern to identify and use.
Having said that, there are two ways to spot the Butterfly pattern on your chart. One is through the manual recognition of the chart by your humble self, and another is through the use of tools.
1. The Manual Method
While this may take some getting used to, it is quite fulfilling. And to make it easier, you need to be on the lookout for M’s and W’s on your chart. When you see the last leg of the M or W forming, draw your XABCD lines to see what harmonic pattern is forming before you and how to use it. Then, compare the Fibonacci ratio of the pattern forming before you with that of the Butterfly pattern we described earlier. Trading platforms, like TradingView, offer features that help you draw out these lines and measure their Fibonacci ratios.
Also, you don’t need to know what the Harmonic patterns look like by heart. Our harmonic patterns cheat sheet, which you can download for free, helps you with that.
2. The Use of Tools and Indicators
The easier method of identifying the Butterfly pattern is through the use of tools like Harmonic Scanners and Indicators. But note that because this pattern, and other harmonic patterns are quite hard to spot for many traders, these tools tend to come for a fee.
The Butterfly Pattern Trading Strategies
To trade the butterfly extension pattern – we mention, once again, the combination of the butterfly pattern and Fibonacci retracement levels as the main trading strategy and tool for using this pattern. Without Fibonacci levels, identifying entry levels is a hard task and can be challenging even for the most experienced forex traders.
Like many other technical analysis indicators and chart patterns, the butterfly chart pattern works in both directions—meaning bullish and bearish.
1. Bullish Butterfly Pattern
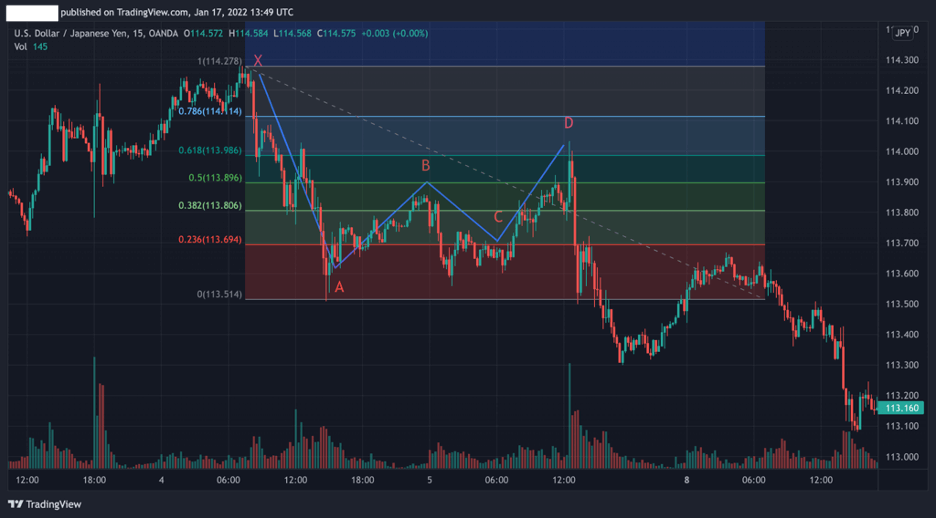
In the example below, we can see how the bullish butterfly pattern is formed on the USD/JPY 15 min chart. As previously mentioned, the best way to find entry levels is by using Fibonacci retracement levels.
In this chart, we can see that the CD line is longer than the XA line, and there are two descending highs. Finally, when the price consolidates around point D, it bounces back and the bullish mini-trend begins.

2. Bearish Butterfly Pattern
The bearish butterfly chart pattern is exactly the same as the bullish one, but obviously, in the other direction.
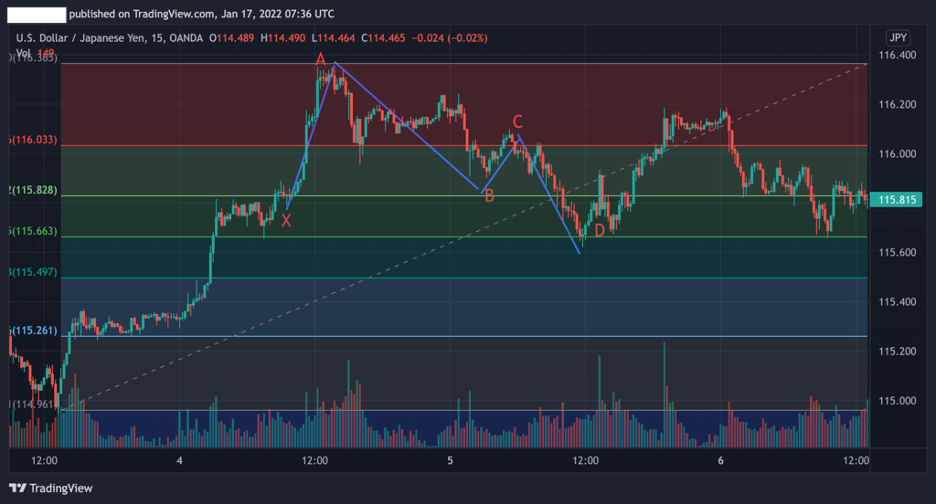
In the example below, we can see how the bearish butterfly pattern is formed at the end of a bullish trend. The price retests at the B and finally at the D levels confirm the bearish trend that indeed occurs.
Once again, we used the Fibonacci retracement levels at the XA line, which is the first bearish line of the butterfly pattern. As you can see, the D level stops at 61.8% level, and from that point, there’s a clear bearish trend reversal.
What are the Benefits and Limitations of the Harmonic Butterfly Pattern?
Here are the most common pros and cons of trading the harmonic butterfly pattern:
Pros
- An accurate and reliable chart pattern, especially when combined with Fibonacci retracement levels
- Compared to other chart patterns, the butterfly pattern provides a strong indication for trend reversal
- Stop-loss placement is clear at the X level
Cons
- The butterfly pattern can often be mistaken with the double top and bottom chart patterns
- Relatively difficult to identify the pattern
- Requires knowledge of other technical analysis tools such as Fibonacci, moving averages, and RSI
Everything About the Butterfly Pattern in One Video
Watch this video to learn how to identify and trade the harmonic butterfly chart pattern.
When is the Best Time to Enter a Position When Trading the Butterfly Pattern?
The confirmation of the butterfly pattern occurs when the price hits the D point and collides with one of the Fibonacci retracement levels. As such, when you identify the trend reversal at the D price level, you can enter a position with a stop-loss order at or near the X or B point.
Key Takeaways
To sum up, here are the key takeaways:
- The butterfly pattern is a trend reversal chart pattern used to identify trend reversals and find good entry levels
- Although it is a fairly complicated chart pattern to identify and use in forex trading, the butterfly pattern is among the most reliable and accurate patterns that help traders find trading opportunities, if used correctly
- To find entry levels by using the harmonic butterfly pattern – it is best to draw Fibonacci retracement levels from the X peak to the A level.
- When using butterfly patterns, a trader should enter a trade at point D
Frequently Asked Questions (FAQs)
Here are some of the most frequently asked questions about the harmonic butterfly pattern in forex:
How do you trade butterfly harmonic patterns in the forex market?
Well, basically, the butterfly pattern is a reversal pattern with four legs, and should be used in combination with Fibonacci retracement levels. The pattern helps traders to identify the end of the prior trend.. Simply put, you’ll need to identify the first bullish or bearish line (the XA leg), and draw the Fibonacci retracement levels from the X level to A level. Then, after finding the butterfly pattern, enter a position at the D level (and, where the price hits a Fibonacci level) with a stop-loss order at the X or B levels.
What Fibonacci levels should I use to trade the butterfly harmonic pattern?
To trade the harmonic butterfly pattern, you can use specific Fibonacci ratios from 0.0% to 261.8%. However, some traders claim that additional levels can be useful when using this pattern. This includes 78.6%, 88.6%, and 127%.
Risk Disclosure: The information provided in this article is not intended to give financial advice, recommend investments, guarantee profits, or shield you from losses. Our content is only for informational purposes and to help you understand the risks and complexity of these markets by providing objective analysis. Before trading, carefully consider your experience, financial goals, and risk tolerance. Trading involves significant potential for financial loss and isn't suitable for everyone.