The shark candlestick pattern is a new harmonic chart pattern discovered in 2011 by Scott Carney that indicates a trend reversal possibility. So far, the pattern has been proven highly accurate and can be used by traders to identify trend reversals and find successful trading opportunities.
- The Shark Harmonic Pattern, characterized by its steep price moves and extreme Fibonacci ratios, is a unique tool for identifying potential market reversals.
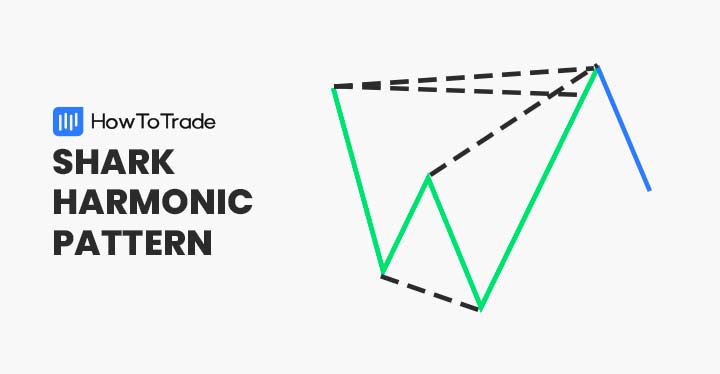
- This pattern typically consists of a five-point structure (O, X, A, B, C) and is renowned for its ability to forecast sharp price changes.
- Traders often use the Shark pattern in conjunction with other technical indicators, utilizing its predictive nature for setting up high-probability trade entries and exits.
In this article, we will explore the harmonic shark pattern and help you learn how to identify and trade this chart technical analysis chart pattern. Keep reading to learn more.
What is the Shark Harmonic Candlestick Pattern?
Discovered by Scott Carney in 2011, the Shark harmonic pattern is a five-leg reversal pattern largely dependent upon the powerful 88.6% retracement level and the 113% reciprocal ratio. In addition, it has a chart formation called an Extreme Harmonic Impulse wave, which looks like the M letter for a bullish shark pattern and W for a bearish shark pattern.
As with other harmonic chart patterns, the shark harmonic candlestick formation must meet several Fibonacci ratios to be valid. It also aims to predict future price movements using previous price swings and geometric shapes.
However, Scott Carney used another method for the famous five-swing harmonic pattern points. Unlike other harmonic patterns with the following swing points – X, A, B, C, and – Carney developed another method for the shark harmonic pattern using these price points – O, X, A, B, and C.
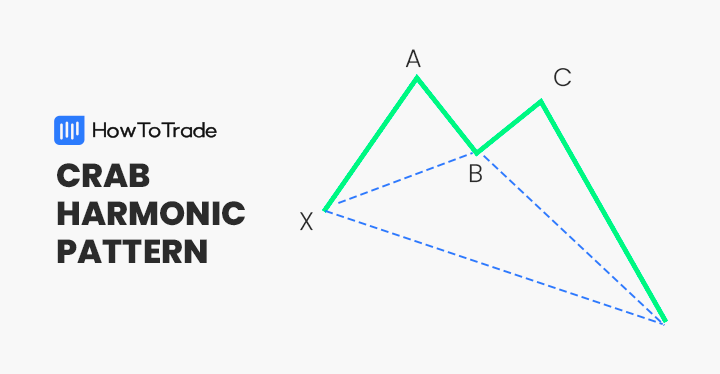
Apart from the different swing point labeling and the unique Fibonacci ratio Carney invented for the shark pattern, it is similar in structure to the Cypher pattern, the Bat pattern, and the Crab pattern. To learn how to correctly identify harmonic formations, many traders use a downloadable harmonic patterns cheat sheet.
How to Identify the Shark Harmonic Pattern in Forex Trading?
To identify the shark harmonic pattern, you first need to know its characteristics. As we previously mentioned, the Shark pattern has a five-point price swing structure (O, X, A, B, and C), with four legs labeled differently than other harmonic candlestick patterns (OX, XA, AB, and BC).
What’s more, the shark pattern must meet the following conditions to be valid:
- AB leg retraces between 113% to 161.8% Fibonacci ratio of XA leg
- The BC leg extends beyond the O point by 113% Fibonacci ratio of the OX leg
- The BC price swing is an extension of 161.8% to 224% of the XA wave
- The length from O to C is 88% to 113%
- The CD leg is at 50% of the Fibonacci retracement level of the BC leg
Crucially, drawing the shark pattern manually means you‘ll have to spend a great deal of time and effort as you need to calculate the ratios on your own. Alternatively, you can use a built-in harmonic shark indicator available on some popular trading platforms (including the MetaTrader4).
However, if you are using TradingView, keep in mind that the popular charting software does not come with a shark harmonic indicator. You can use the XABCD pattern tool for that purpose, though.
Taking the above into consideration, let’s see an example of a bullish shark pattern:

As you can see in the GBP/USD daily chart above, the bullish shark pattern is formed following a bearish trend with four price swings and five points (the labeling is different as we are using TradingView charting software). When the market reaches the D point, the pattern is confirmed and the price ultimately reverses.
The Shark Harmonic Pattern Trading Strategy
Trading the shark pattern has the same goal as many other harmonic chart patterns. You are looking for a trend reversal in the price action following four price swings and the assumption that the price is about to reverse.
Regarding the trading technique when using TradingView charts, the difference between the shark pattern and the XABCD tool is that the entry-level is taken on point C rather than point D. Take profit is then placed on the D point, and the shark pattern also has another well-defined stop loss level at the 113% Fib level XA leg.
Keep in mind that the shark harmonic pattern is better suited for short-term gains rather than trying to capture long-term moves. So, with that in mind, let’s take the example above and show you a step-by-step process to trade the harmonic shark pattern.
1. Find an Entry Point
While trading the shark harmonic pattern, you’ll be looking to enter a trade at point C (in our chart point D). This is because the O to C (D to X in our chart) retracement can be between 88.6% to 113%, so as soon as you can see that this condition is satisfied, you can enter a buying trade at point C (D in our chart).
But, before you do that, it’s also essential to confirm the reversal with other trend reversal technical indicators. Two such technical indicators are the RSI and MACD, which assist in finding whether the existing trend is losing momentum.

The next step is to draw Fibonacci retracements from the X to A point. As a reminder, when trading the shark pattern, the entry point is at 88.6% of OX (XD in our chart). This level represents an exhaustion mode where sellers cannot push prices lower and indicate the possibility of a price reversal.

2. Set a Stop Loss
After entering a trade, the next step is to set your stop. There are various methods to determine where the stop loss should be placed with the shark pattern – The most common method is to place a stop loss at point C (D in our chart), which is a very tight stop loss and can be easily triggered. However, the logic behind placing the stop loss at this level is that a break below the D point will automatically invalidate the Shark pattern.

In addition, you can also use the protective stop loss at the 113% Fibonacci extension of the XA leg if you prefer a more flexible stop loss level (as you can see in the chart below).

3. Set a Take Profit Target
Finally, the last step is to set a target for profits. Once again, another advantage of the shark harmonic pattern is that it has a clear take profit target at the 50% to 61.8% Fib ratio of the BC swing leg. The second and third TP levels can be placed at the A and C levels.

What are the Benefits and Limitations of the Shark Harmonic Pattern
Below, you can check the pros and cons of trading the shark pattern.
Pros
- Highly accurate chart pattern
- The shark pattern provides a well-defined entry point, stop loss, and take profit target
- The harmonic shark pattern offers an excellent risk-reward ratio
Cons
- Complicated chart pattern for beginners
- Requires an external plugin that is not available on all trading platforms
Everything About the Shark Harmonic Pattern in One Video
You can check this video by our trading analysts on how to identify and trade the harmonic shark pattern.
To sum up, here are the most important factors to consider when using shark harmonic patterns:
- The shark harmonic pattern is a 5-0 trend reversal pattern with unique Fibonacci ratios and a set of rules
- To trade the shark harmonic pattern, a trader will be looking to enter a trade at C point, which is the 88.6% retracement of OX
- Stop-loss is placed at D level or 113% Fibonacci level of the XA leg
- To trade this pattern, you need to draw a resistance level and a neckline
- Take profit is located at 50% to 61.8% Fib ratio of BC or at A or B levels
Risk Disclosure: The information provided in this article is not intended to give financial advice, recommend investments, guarantee profits, or shield you from losses. Our content is only for informational purposes and to help you understand the risks and complexity of these markets by providing objective analysis. Before trading, carefully consider your experience, financial goals, and risk tolerance. Trading involves significant potential for financial loss and isn't suitable for everyone.