The crab chart pattern is a unique harmonic candlestick formation seen on charts that helps traders find trend reversal and trade opportunities.
With its unique Fibonacci ratios, the crab harmonic pattern gives a clue about the beginning of a new market trend and like many other harmonic price patterns, it is considered a very accurate and reliable chart pattern.
- The Crab chart pattern is a harmonic pattern used by traders to predict potential price reversals with high accuracy.
- This pattern is recognized by its distinct shape, which resembles a crab, and is known for its precise Fibonacci retracement and extension levels.
- Traders often rely on the Crab pattern to identify optimal entry and exit points, especially in volatile markets, due to its strong predictive power.
Here, in this article, we explain how the harmonic crab pattern works and how to identify and trade it.
- What is the crab candlestick pattern?
- How to identify and use the crab candle pattern in trading?
- How to trade the crab candlestick pattern – Strategies and examples
- What are the Benefits and Limitations of the Crab Pattern?
- How is the Crab Pattern Different From Other Harmonic Patterns?
- Harmonic Crab Pattern (VIDEO)
- Key takeaways
- Frequently Asked Questions
What is the Crab Candlestick Pattern?
The crab chart pattern is a harmonic extension candlestick pattern similar to the butterfly chart pattern. It was discovered by Scott Carney in 2000 and is known as one of the most powerful and accurate technical analysis chart patterns.
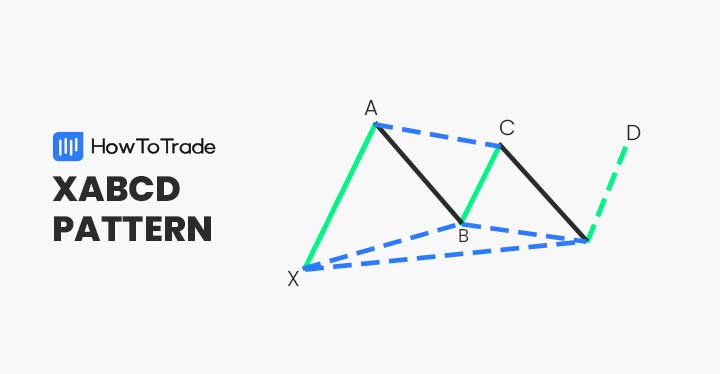
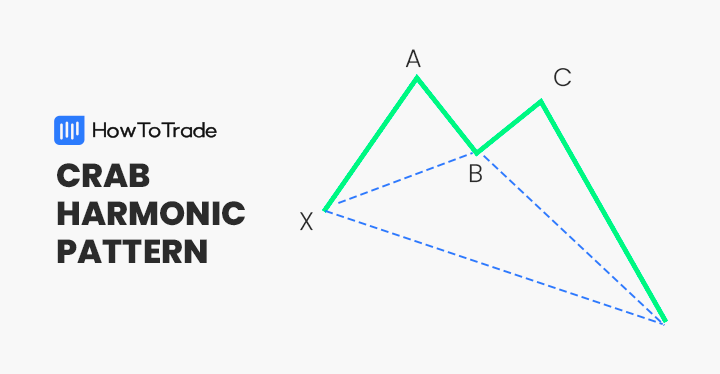
Like other harmonic patterns, the crab pattern has five points and four price swings. The five points include the X, A, B, C, and D, while the four price swings include the XA, AB, BC, and CD. While the structure is quite similar to most harmonic patterns, the crab pattern’s difference is that the CD leg has a longer extension, meaning that the D point is far away from the X point.
Additionally, the crab pattern can be either bullish or bearish depending on its location on a price chart. Ultimately, when the pattern appears, it signals the end of the existing trend and the beginning of a new market trend.
How to Identify and Use the Crab Candle Pattern in Trading?
As with many other chart patterns, the first step you need to take is to identify the precise harmonic pattern on a price chart. The process is a bit complicated when it comes to harmonic trading, mainly due to the exact Fibonacci ratios that must be formed for the pattern to be valid.
1. Look for M’s and W’s, then Match Fibonacci Ratios
The Crab pattern, when you zoom out of the chart a little bit, will look like the alphabets “M” and “W”. This is your trick to spot harmonic patterns. But to be sure if what you’re looking at is indeed the crab pattern, we introduce the Fibonacci ratios that set the pattern apart from other harmonic patterns.
Remember that every harmonic pattern, like the Gartley pattern, Cypher pattern, XABCD pattern, bat pattern, and harmonic shark pattern, has unique ratios that must occur so the pattern would be valid.
With that in mind, here are the Fibonacci ratios and measurements you need to verify that the crab pattern is valid.
- AB leg retraces between 38.2% and 61.8% of the Fibonacci ratio of the XA leg.
- The BC price swing is an extension of 38.2%-88.6% of the AB wave.
- The CD leg is the longest and retraces at 161.8% of the XA leg and between 224-361.8% of the BC leg.
- C point must never go past A point.
- D point extension is at 161.8 % Fib ratio of XA leg
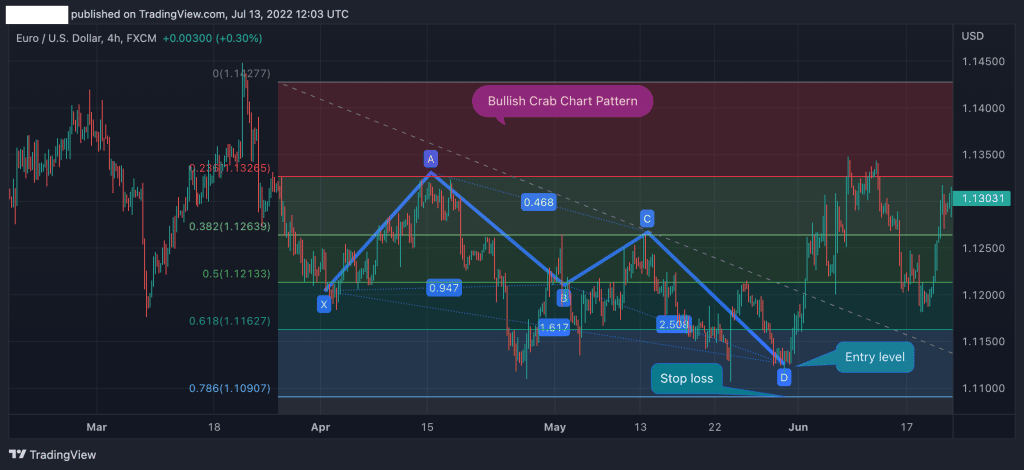
Considering the above rules and ratios, let’s see what the crab pattern looks like on a trading chart.

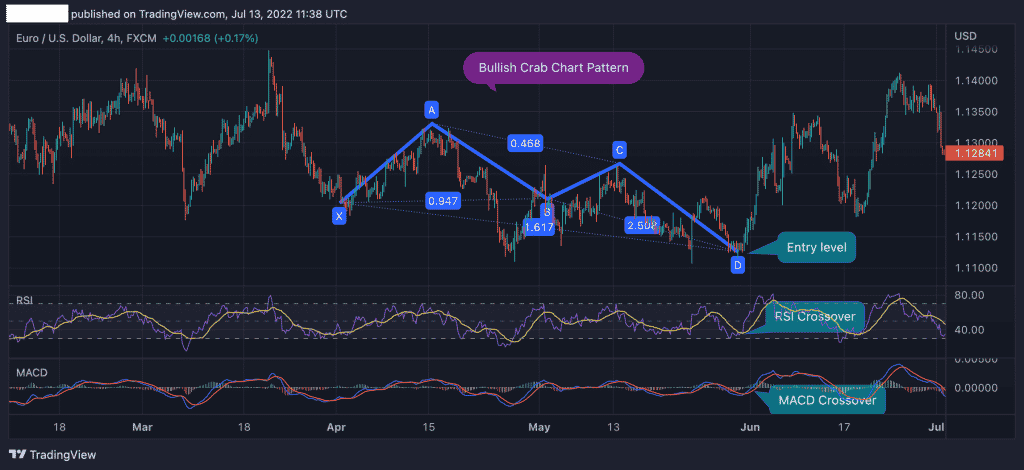
The EUR/USD 4h chart above shows a bullish crab pattern formed with all the relevant ratios. In this case, point D, which is a potential reversal zone, serves as the ideal entry-level price and signals the beginning of a new trend.
2. Use Indicators or Harmonic Scanners
If you’re using any of the popular trading platforms, MetaTrader and Trading View, you’re likely to find indicators that can help you identify the crab pattern right there on your chart. Another option is to use harmonic scanners.
It’s worth mentioning, though, that because these patterns are typically hard to spot, especially for new traders, these tools may not be free.
How to Trade the Crab Candlestick Pattern Trading Strategy
Once you have identified the crab chart pattern, trading it is pretty straightforward. Generally, you need to enter a position at point D and place a stop-loss order at point X.
So, in this section, we will show you how to trade the crab pattern using technical indicators to confirm the reversal. For this example, we present it on a bullish crab pattern, but the rules are the same for the opposite version, the bearish crab pattern.
1. Crab Pattern – Find and Entry Level
The first thing you need to do is to find the ideal entry-level. Fortunately, harmonic patterns like the crab pattern offer traders a well-defined entry level that signals the exact level where prices are likely to change direction.
Yet, we want to confirm the reversal, which can be done using momentum indicators and Fibonacci support and resistance levels.
Using the example above, we added two of the most popular momentum indicators to confirm the reversal – the Relative Strength Index (RSI) and Moving Average Convergence Divergence (MACD). As you can see, both indicators signal that a change in market sentiment is likely to happen at point D.
2. Crab Pattern – Set a Stop Loss
The most notable disadvantage of the harmonic crab pattern is that there is no precise level to set a stop loss order. Unlike the Cypher pattern, which has a clear level at point X to set a stop loss, trading the crab pattern requires you to use Fibonacci levels to find a stop loss level.
Also, note that if prices fall below (or above for the bearish pattern) the D point, the crab pattern is invalid. Still, the best technique to find a stop loss level when trading the crab harmonic pattern is to use Fibonacci retracement levels.
As you can see in the image above, we have drawn Fibonacci retracement levels from the lowest to the highest level of the previous price swing. In this case, we can use the 78.6% as a stop loss level as a break below will invalidate the crab pattern.
3. Crab Pattern – Set a Take Profit Target
Lastly, you need to know where to place a profit target. The good thing with the crab pattern is that you can use each point as a profit target – X, B, C, and A.
Furthermore, points A, B, and C intersect with Fibonacci retracement levels. This enables you to use these levels as profit targets or support levels if you decide to extend your position.

What are the Benefits and Limitations of the Crab Pattern?
Here are the pros and cons of trading the crab harmonic pattern.
Pros
- Extremely accurate chart pattern
- Excellent risk reward ratio
- Take profit level is well defined
Cons
- Trading the harmonic crab pattern could be complicated for beginner traders
- Difficult to find and identify on trading charts
- There is no clear level for a stop loss
How is the Crab Pattern Different From Other Harmonic Patterns?
While the Crab pattern shares similarities with other harmonic patterns like the Bat, Butterfly, and Gartley, its distinct characteristics set it apart.
1. Extreme CD Leg
The most prominent feature of the Crab pattern is its extended CD leg. This leg typically extends beyond the 224% projection of the AB leg, creating a more dramatic price move compared to other patterns. For instance, while the Bat and Butterfly patterns also have extended CD legs, they are generally shorter than the Crab’s.
2. Fibonacci Ratios
All harmonic patterns utilize Fibonacci ratios, but the Crab’s unique profile is defined by specific numerical values. A deeper retracement at point B (usually between 38.2% and 61.8% of XA) and an exceptionally extended CD leg (typically between 224% and 361.8% of AB) differentiate it from other patterns. The Bat and Butterfly, for example, have different Fibonacci parameters.
3. Potential Reversal Zone (PRZ)
Due to the elongated CD leg, the Crab pattern’s PRZ is often positioned further from point X compared to other patterns. This characteristic offers the potential for larger profit targets but also increases risk. In contrast, the PRZ in patterns like the Bat or Butterfly is generally closer to point X.
Everything About the Harmonic Crab Pattern in One Video
You can check our detailed video on how to identify and trade the harmonic crab pattern.
Now, let’s check the key takeaways from this article.
- The crab pattern is an extension harmonic trend reversal pattern that help traders identify the beginning of a new trend
- The crab pattern, which can be either bullish or bearish, has five points, four price swings, and unique Fibonacci ratios
- There are two other variations that are similar to the original crab pattern – the bearish deep crab pattern and the bullish deep crab pattern
- When the crab pattern appears, a trader enters a position at point D
- Stop loss is placed at the closest Fibonacci level
- Take profit could be placed at each one of the Crab pattern’s points – X, A, B, and C
Frequently Asked Questions about the Crab Pattern
Here are some of the most frequently asked questions about the harmonic crab pattern in forex trading:
What is a deep crab chart pattern?
The deep crab chart pattern is very similar to the standard crab pattern in terms of the formation and structure of the pattern. However, one difference between the bearish and bullish deep crab pattern and the crab pattern is the B retracement ratio. While the B retracement ratio in regular crab patterns lies between 38.2%-61.8%, the B retracement level in the deep crab pattern must be at the 88.6% Fib ratio.
How to draw the harmonic crab pattern?
One of the biggest challenges in using harmonic patterns is to draw them. Clearly, most people cannot remember all ratios, and drawing the pattern could take a long time, something active traders cannot afford. Luckily, on most trading platforms, you can draw the crab chart pattern with a built-in feature. With this feature, you simply stretch the XABCD points and find the necessary ratio, so the pattern is valid.
What is the difference between Crab harmonic patterns and Butterfly patterns?
The crab and butterfly patterns are very similar in terms of structure and the formation of the pattern. Still, there are two things that differentiate the two patterns. First, the D retracement of the crab pattern is much longer than the one of the butterfly pattern. The D point of a butterfly pattern has an extension ratio of 161.8% to 261.8%, while the D point of a crab pattern has a ratio of 224% to 361.8%. Secondly, the B-point retracement of the XA leg is at 78.6% for the butterfly pattern and 38.2%-61.8% for the crab pattern.
Risk Disclosure: The information provided in this article is not intended to give financial advice, recommend investments, guarantee profits, or shield you from losses. Our content is only for informational purposes and to help you understand the risks and complexity of these markets by providing objective analysis. Before trading, carefully consider your experience, financial goals, and risk tolerance. Trading involves significant potential for financial loss and isn't suitable for everyone.