How to Use Moving Average Crossover to Enter and Exit Trades
Now that you know how to plot the moving averages on your chart and determine price trends, let’s show you how to use the moving average crossovers to execute your trades.
Quick Recap: How to Use Moving Averages To Identify Trend Direction
As you already know, no secret formula calculates how long a specific trend will last. Some are short-lived, while others last for days, weeks, or even months. However, moving averages can help shed some light on trends and trend strength.
Below are a few moving average observations that can help quantify trending markets:
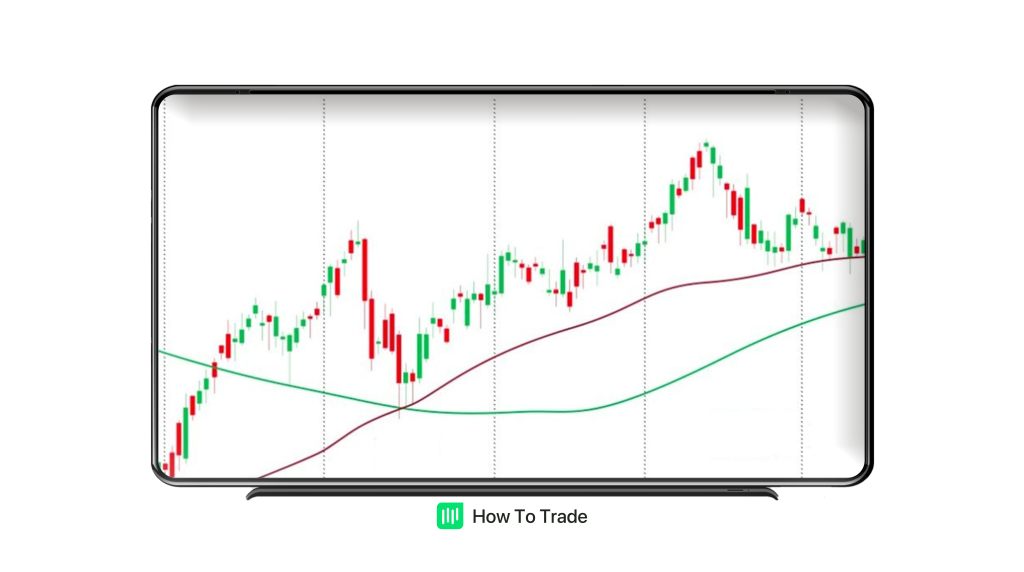
- When the price is beneath a moving average, the prevailing trend is bearish.
- The prevailing trend is bullish when the price is above a moving average.
- The steeper the slope of the moving average, the stronger the prevailing bullish or bearish trend.
In reality, reading an exponential, smoothed, simple, or weighted moving average is pretty simple stuff. They reflect a periodic average price, and the prevailing trend defines price action. However, when we incorporate multiple moving average values, things get a bit more complex.
What Is A Moving Average Crossover?
A moving average crossover is a technical tool in forex that occurs when two different moving average lines cross over one another. Therefore, a moving average crossover strategy is a comprehensive plan designed to help forex traders enter and exit trades. Simple as that!
By definition, moving averages are lagging indicators. The crossover technique may not capture exact tops or bottoms of the prevailing trend. However, the moving average crossover strategy can definitely help traders identify the bulk of a trend.
A robust moving average crossover strategy can help forex traders answer the following questions:
- What’s the prevailing trend direction?
- Where is a potential entry point for a trend trade?
- Is a reversal imminent?
Perhaps the best thing about this strategy is that it is self-contained. All you have to do is drop a couple of moving averages on your chart, grab a beer, and wait for them to crossover. They can be any type, from the simple moving average to the exponential moving average. The choice is yours!
If you’re lucky enough and the moving averages cross over one another, it could signal that the trend is about to change soon, giving you the chance to get a better entry. And, by having a better entry, you have the chance to bag more pips!
What are the Major Moving Average Crossover Strategies?
There are various moving average crossover strategies for catching many trading opportunities.
1. Golden Cross
For the golden cross, we need two averages with different periods: a shorter period moving average and a longer period moving average. When the shorter period MA crosses, the longer period MA bottom-up, it’s a buy signal.
When using simple moving averages, the 50- and 200-period SMAs are the short and long-term moving averages, respectively. So when the 50 SMA crosses to the upside of the 200 SMA, we have a golden cross.
To make things super-duper clear, let’s examine an example of when a golden cross occurs on the GBPUSD chart.
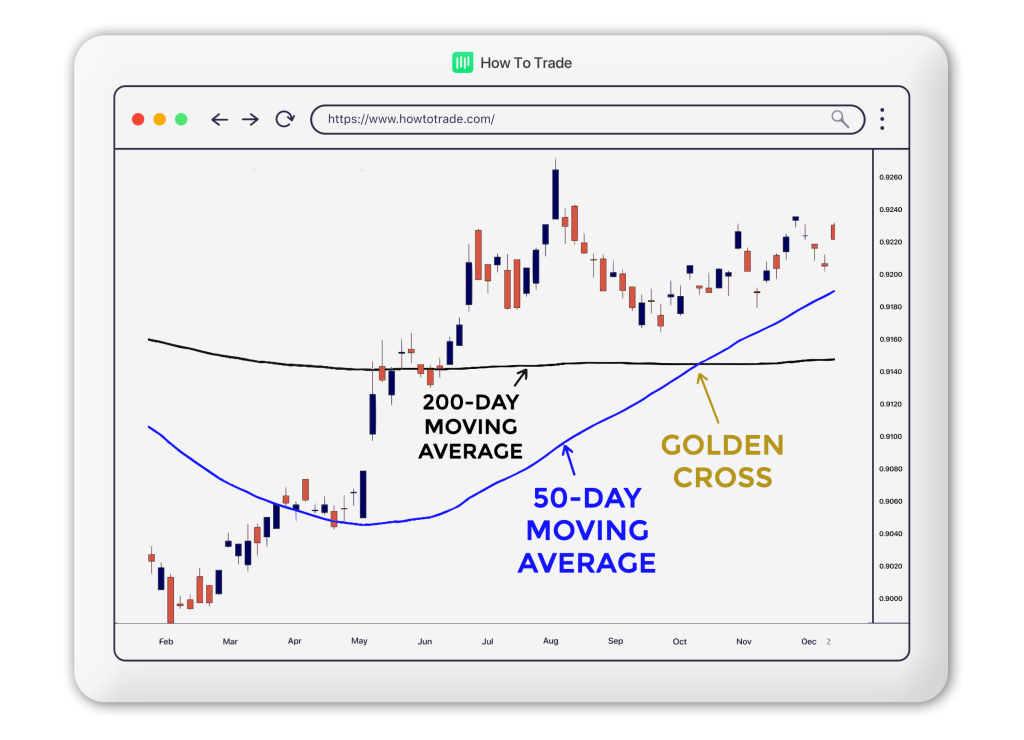
As you can see, we plotted two moving averages: a 50-day moving average and a 200-day, much slower moving average. Notice that the MA with a shorter period crossed the MA with a longer period; we now know this as a golden cross. That’s your buy signal. And if you were previously in a bearish trade, now may be a good time to exit your trade and take your profit.
2. Death Cross
Inversely, if the MA with a shorter period breaks below the longer or slower moving average, then it’s a sell signal. Remember, it doesn’t matter if you use smooth, simple, or exponential moving averages – it’s all good!
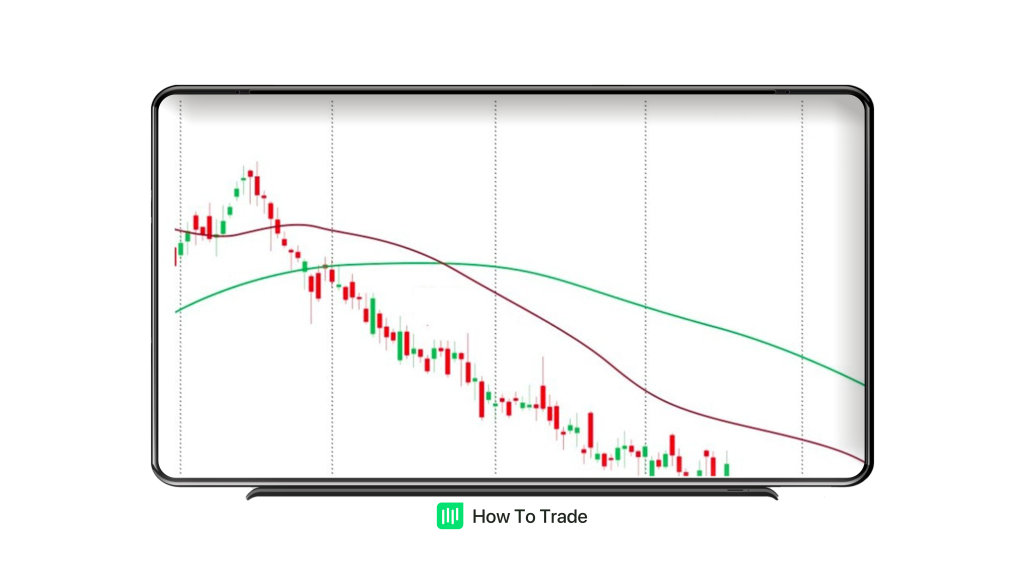
But with two simple moving averages, your death cross usually is when the 50-period moving average crosses below the 200-period moving average.
3. Moving Average Ribbon
A moving average ribbon is made up of many moving average indicators. You can create this yourself by applying multiple moving averages of various periods to your price chart. When the moving average with the shortest period crosses over those with longer periods, you have your buy signal. Conversely, when the shorted-period moving average crosses below the longer-period moving averages, you have an opportunity to sell.
Key Takeaways
- The moving average is a technical indicator that’s reliable in catching multiple trend reversals from their origins. It’s also a great trend trading tool.
- One way to determine trade exits and entries using the indicator is through moving average crossovers. And as the name suggests, crossover signals come when one moving average crosses over another. That’s how any moving average crossover system works.
- The golden cross is a moving average crossover strategy that occurs when a shorter-period moving average crosses above a longer-period MA. Typically, these short and long-period moving averages are 50 and 200, respectively. You should buy or exit your sell positions when you see a golden cross.
- The Death Cross Moving Average crossover strategy is the opposite of the Golden Cross. It signals a sell trade. And if you were previously in a buy trade, exit at this death cross.
Conclusion
Moving average strategies are a great way of staying on top of trends and reversals. Whether you use a smooth, exponential, or simple moving average, each can be a powerful technical analysis trading tool. However, things get even better when you combine these trading strategies with other technical indicators, such as the Moving Average Convergence divergence (MACD) indicator.
Finally, not every trade will be winning trades. You’ll lose money. But the basic idea behind the strategy is simple: You can take trade entry and exit using the crossover of two or more moving averages. You can also identify trends using the same. How you structure your trading plan around this strategy is ultimately up to you and the other things you’ll learn in the following courses.
The next lesson will examine how moving averages work as support and resistance levels. When you’re ready, check out how these concepts can help improve your overall trading strategy.


0% Commission Accounts
- Trade 1,000’s of global markets.
- 0% deposit and withdrawal fees.
- Rapid funding turn-around times.
- Trade on MetaTrader 4 and 5.