The Cypher harmonic pattern is a technical analysis indicator used by traders to identify valuable support and resistance levels based on the Fibonacci sequence of numbers and detect trend reversals.
- The Cypher Harmonic Pattern is a complex and reliable technical analysis tool, known for its distinctive XABCD structure, used to predict market reversals.
- This pattern is identified through precise Fibonacci measurements between its four points, signaling potential bullish or bearish movements.
- Traders value the Cypher pattern for its high accuracy in forecasting, often employing it in conjunction with other indicators for effective trade setups.
In this article, we explain how the Cypher harmonic pattern works, identify it, and trade it.
- What is the Cypher Harmonic candlestick pattern?
- How to Identify the Cypher Harmonic pattern in Trading?
- How to trade the Cypher Harmonic pattern
- What are the Benefits and Limitations of the Cypher Harmonic pattern – Pros and cons
- Cypher Harmonic pattern (VIDEO)
- Key takeaways
- Frequently Asked Questions (FAQs)
What is the Cypher Harmonic Candlestick Pattern?
The Cypher harmonic pattern is a technical analysis formation indicating a price-action reversal.
The pattern was discovered by Darren Oglesbee and is known as a relatively advanced pattern formation. In structure, the Cypher pattern is similar to the butterfly harmonic pattern; however, the Cypher is not a very common chart pattern due to its unique Fibonacci ratios.
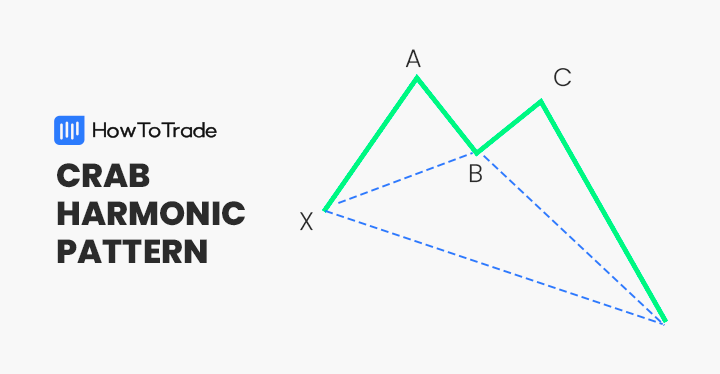
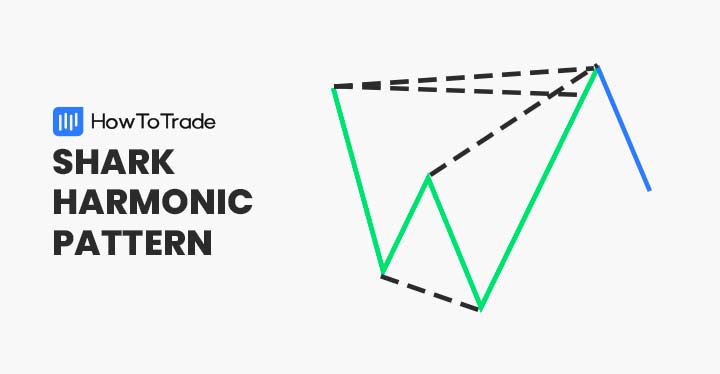
Other widely used harmonic geometric patterns include the Gartley pattern, the XABCD pattern, the AB=CD pattern, the bat pattern, the shark pattern, and more.
The Cypher pattern, which can be either bullish or bearish, has five points (X, A, B, C, and D) and four legs (XA, AB, BC, and CD). Like any other harmonic pattern, the theory behind the Cypher chart pattern is that there is a strong correlation between Fibonacci ratios and price movements.
Eventually, the market is expected to reverse from point D after the four market swing wave movements – X to A, A to B, B to C, and C to D.
How to Identify the Cypher Harmonic Pattern in Trading?
There are two main ways to identify the Cypher harmonic pattern on your chart. The first is the manual method, which you have to train your eye for. The second is with the use of trading tools.
1. Look for M’s and W’s
The Cypher pattern resembles an “M” or “W” shape at a first glance, and that’s what you should try to look for on your chart. This trick can potentially help you spot other harmonic patterns. However, to accurately identify a Cypher pattern, precise Fibonacci ratios are crucial, as they distinguish it from other harmonic formations.
The specific Fibonacci ratios for the Cypher harmonic pattern are the following:
- B point retracement of the primary XA leg ranges between 38.2% to 61.8% Fibonacci levels
- C point is an extension leg with a Fibonacci ratio that should be between 127.2% and 141.4% of the primary XA leg
- D point should break the 78.6 retracement level of XC
Taking the above in mind, let’s see what the Cypher harmonic pattern looks like on a trading chart.

The EUR/JPY 1H chart above shows us how the bullish Cypher pattern is formed by the two tops (A and C) and three bottoms (X, B, and D). Moreover, all the Fibonacci ratios match the pattern’s requirements, and indeed, the D point serves as a bullish reversal point.
2. Use Harmonic Pattern Tools
Another way to identify the Cypher harmonic pattern is to use indicators and scanners that automatically scout for these patterns on the chart. Keep in mind, though, that these tools may not be free.
How to Trade the Cypher Harmonic Pattern
Now that you know what it looks like on candlestick charts and how it works, the next step is to figure out how to use and trade this Cypher pattern trading strategy.
However, before explaining how to trade the pattern, you must first know that you can draw the pattern with a Cypher built-in feature available on most trading platforms (including the Cypher Pattern indicator on MetaTrader4). To do so, you need to locate the X point automatically stretch the lines and create a zigzag pattern.
After you grasp how to draw the Cypher pattern on a price chart, you need to find where and when to enter a valid Cypher pattern trade, set a stop loss, and take a profit target. Make no mistake, trading the Cypher chart pattern is not easy, especially compared to other basic classical chart patterns.
That said, let’s see how you can trade the Cypher pattern.
1. Find an Entry Point
Like other harmonic patterns, the thing with any harmonic Cypher pattern is that the Fibonacci ratios between the points have to match for the pattern to validate, or you do not take the trade. This is how it works with harmonic chart patterns – they have exact numbers and shapes that must occur for a trade to be made.
So, once the pattern is confirmed at point D, a trader will enter a position at this level. Yet, you always want to increase the chances of success rate when using chart patterns.
To find the ideal entry point, you can use any trend reversal indicator that can assist you in confirming the reversal. Such tools include the RSI, MACD, and Stochastic.

2. Set a Stop Loss
Since the Cypher pattern is based on Fibonacci levels, it is helpful to draw Fibonacci retracement levels from the lowest to the highest point of the previous trend on a higher time frame. It will help you better visualize the asset’s past performance.
However, locating a reasonable stop-loss level when trading the Cypher pattern is simple and does not necessarily require the combination of Fibonacci retracements.
All you need to do is place the stop loss somewhere below the D level because if this level breaks, the entire Cypher pattern is invalidated. So, the stop would be placed at the next support or resistance level, which is the X-point (as you can see in the chart below).

3. Set a Take Profit Target
Lastly, you need to locate profit targets. The simple Cypher pattern trading method is using its points as profit targets, meaning the B, A, and C levels. Another way to find take-profit targets is to draw Fibonacci retracements using the previous primary price swing.
As you can see in the EUR/JPY 1H chart below, the Fibonacci tool helps you find take-profit targets, and you can set your orders at any one of the following Fibonacci retracement levels.

What are the Benefits and Limitations of the Cypher Harmonic Pattern
Let’s check some of the pros and cons of the cypher pattern.
Pros
- Highly accurate chart pattern
- Entry point, stop loss, and take profit targets are well defined
- One of the most profitable harmonic patterns
Cons
- An advanced charting pattern – not suited for beginners
- Cypher harmonic patterns are difficult to trade, particularly in lower time frames
- Requires more effort than other technical analysis tools and trading strategies
Everything About the Cypher Pattern in One Video
You can check this video by our trading analysts on identifying and trading the cypher harmonic pattern.
Key Takeaways
In conclusion, here are the key takeaways:
- The Cypher is a harmonic trend reversal candlestick pattern that helps traders get a signal of the end of the existing market trend
- While trading the Cypher harmonic pattern indicator, traders must follow a set of rules. If the Fibonacci ratios between the five points don’t match, a trade should not be made
- Once the Cypher pattern is identified, a trader enters a position at the D point with a stop loss below or above the X level (bullish Cypher pattern or bearish Cypher pattern)
- Take profit is placed at B, A, or C levels or at one of the following Fib levels
- It is recommended to confirm the reversal with other technical indicators. These include RSI, Stochastic Oscillator, MACD, and Fibonacci retracement levels
Frequently Asked Questions (FAQs)
Here are some of the most frequently asked questions about the cypher chart pattern in forex:
How to draw the Cypher pattern on charting software?
As we mentioned earlier, there’s no need to manually draw the Cypher pattern on Japanese candlestick charts. Instead, you can use a built-in indicator to automatically highlight Cypher harmonic patterns.
What is the success rate of the Cypher harmonic chart pattern?
The Cypher harmonic pattern has been historically proven to be a fairly reliable and accurate chart pattern. According to various studies, the pattern has an accuracy rate of around 70%.
What is the difference between Cypher harmonic patterns and Butterfly patterns?
It’s easy to get confused between the Cypher and butterfly patterns. Both harmonic patterns have a similar formation, and they appear in the same place and signal that the price is about to reverse. The main difference lies in the Fibonacci ratios and, more importantly, the location of point C. In the butterfly chart pattern, the C point is placed below or above the A point for a bullish or bearish pattern, respectively. On the other hand, the formation of the Cypher pattern is the opposite of the butterfly pattern.
Risk Disclosure: The information provided in this article is not intended to give financial advice, recommend investments, guarantee profits, or shield you from losses. Our content is only for informational purposes and to help you understand the risks and complexity of these markets by providing objective analysis. Before trading, carefully consider your experience, financial goals, and risk tolerance. Trading involves significant potential for financial loss and isn't suitable for everyone.