The AB=CD is a basic harmonic chart pattern traders use to identify trend reversals and find trading opportunities.
- The AB=CD Harmonic Pattern is a popular chart formation in technical analysis, known for its simple and symmetrical structure, used to predict potential price reversals.
- This pattern comprises four key points (A, B, C, D) and is identified by equal price legs, offering clear signals for entry and exit points in trading.
- Traders value the AB=CD pattern for its versatility across various markets and timeframes, making it a staple in both forex and stock trading strategies.
Among the various harmonic candle patterns, it is considered the simplest harmonic pattern of all, but only if you know how to use and trade it correctly. Read on to learn more about the ABCD harmonic chart pattern.
What is the AB=CD Candlestick Pattern?
The AB=CD chart pattern, also known as the ABCD pattern, is one of the candlestick harmonic patterns formed on price charts.
These unique formations create geometric patterns using specific Fibonacci ratios and are often used by technical analysis traders to predict future price movements. Beginners often use a harmonic chart patterns cheat sheet in order to learn how to identify the patterns. Some of the most popular and well-known harmonic groups of patterns include:
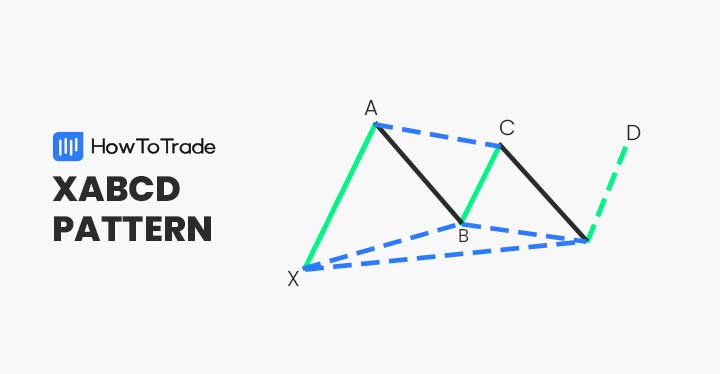
- XABCD chart pattern
- Gartley pattern
- Diamond pattern
- Butterfly pattern
- Shark pattern
- Bat pattern
- Crab pattern
As for the ABCD formation – Finding this pattern helps ABCD pattern traders identify potential reversal zones by using critical numbers in the asset’s past performance. In terms of structure, the ABCD pattern is known as a relatively simple formation to recognize, especially when comparing it to other harmonic chart patterns.
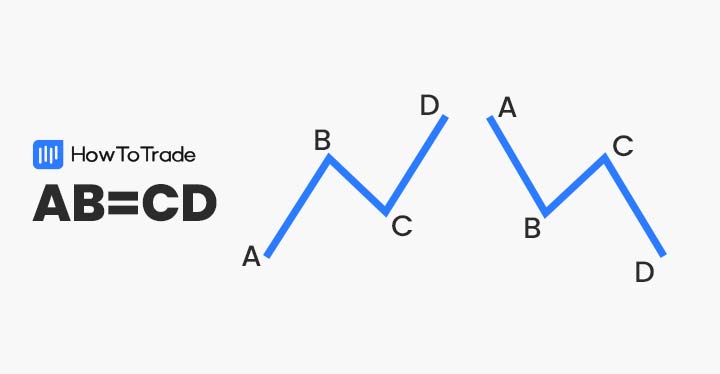
The pattern is made of four points (A, B, C, and D) and three legs (AB, BC, and CD). When the pattern is formed, it creates a zigzag price movement and indicates that the trend will change. Also, bear in mind that the ABCD pattern could be bullish or bearish, depending on its location on the chart.
How to Identify and Use the AB=CD Pattern in Trading?
You need to remember several things to identify the AB=CD harmonic chart pattern.
- First, the ABCD formation consists of three consecutive price swings. A bullish pattern has a down, up, and down movement again. A bearish ABCD pattern has up, down, and up price swings.
- The pattern has four points and three legs – The length of AB must be larger than the length of BC and have the same length as the CD leg
- The pattern must have the following Fibonacci ratios – BC line is the 61.8%-78.6% Fibonacci retracement ratio of the AB line. CD line is the 127.2%-161.8% Fibonacci extension of BC
- For a bearish ABCD trend reversal pattern, point D must be higher than point B. For bullish, point D must be lower than point B
Below, you can see an example of what a bullish ABCD chart pattern looks like on a candlestick chart:

As you can see in the GBP/USD 30-minute time frame chart above, the currency pair is trading downward with a price correction in the middle price swing (BC leg).
By using the built-in ABCD indicators, we were able to identify this geometric pattern with two Fibonacci rules. The BC line is 61.8% retracement level of the AB line. Moreover, the CD line is the 127% extension level of the BC line.
All the above confirm the pattern and offer an entry-level for a trading position at point D.
How to Trade the AB=CD Candlestick Pattern (Trading Strategy)
Once you have identified the ABCD chart pattern, you need to draw it on a trading chart, find the appropriate levels to set entry points, stop loss, and take profit orders.
But no worries, you don’t need to calculate the lines and Fibonacci ratios on your own. Luckily, nowadays, on many trading platforms available to retail investor accounts (including the MetaTrader4), you’ll be able to use a built-in ABCD indicator that automatically draws the pattern for you.
Then, after drawing the ABCD pattern, you need to look for point D, where you enter a position in the opposite direction of the CD line. Additionally, it is always important to be aware of market conditions, and price action behavior, and include fundamental analysis in your trading strategy.
With that in mind, let’s see two examples of the ABCD pattern – bullish and bearish.
1. Bullish ABCD Pattern
The bullish ABCD pattern forms during a downward trend and indicates a potential price reversal, meaning the beginning of a bullish trend.
The three price swings include a drop in price from the A to B level, a correction from B to C level, and another decrease from point C to D level. Ultimately, it creates a zigzag pattern where the D point is the ultimate entry point.

As for stop-loss placement, you can place your stop-loss order below the D point as a break below this level invalidates the ABCD pattern. Take profit, on the other hand, is more well-defined.
You can set your profit target at the C level or A level. However, in case you identify a strong move upward, you can also use Fibonacci retracement levels in the same timeframe to place another level to take profit.
2. Bearish ABCD Pattern
The ABCD bearish version has three ascending price swings before a trend reversal occurs. At first, the pattern begins with a price increase from A to B.
Then, the price falls from B to C and finally rises again from C to D. At this point, when the pattern is confirmed with Fibonacci rules, a reversal is likely to occur.
The GBP/USD 30-minute chart below shows you how the bearish AB=CD pattern is formed on a price chart.

As you can see, much like the bullish ABCD pattern, the bullish AB line is 61.8% of the AC line, and the CD leg is 127.2% of the BD leg. In this case, the D point is the market entry level, stop-loss is placed above the D level, and profit targets are placed at the C and A levels.
The Free AB=CD Trading PDF
If you need something to easily refer to when you’re trading, here’s a concise AB=CD trading PDF. It’s free, by the way:
The AB=CD Pattern – Pros and Cons
Pros
- Highly accurate chart pattern to predict future performance (high winning percentage)
- Once the reversal is confirmed, the AB=CD pattern is an advantageous chart pattern when compared to other patterns
- Usually, the ABCD pattern indicates a strong reversal and provides a trading opportunity to take long term positions
- The pattern is applicable in any market and complex instruments – stock market, forex markets, etc
- Efficient pattern for day trading
Cons
- For beginners – not an easy chart pattern to use when trading forex
- Stop loss is not well defined which increases the risks involved in trading this pattern
Everything About the AB=CD Pattern in One Video
Watch this video by our trading analysts to learn more about identifying and trading the harmonic ABCD pattern.
Key Takeaways
Below, you can find the key points about the ABCD patterns:
- ABCD is a trend reversal pattern that helps traders identify when the price is about to reverse and change direction
- The pattern is characterized by four points and three price swings based on Fibonacci numbers
- To use this pattern, you can draw the ABCD formation by using built-in indicators on trading platforms
- After identifying the ABCD pattern, a trader will enter a position at the D poin
- Stop-loss is placed below point D, and take profit is set at C point or A point
Frequently Asked Questions about the ABCD Harmonic Pattern
Here are some of the most frequently asked questions about the ABCD harmonic chart pattern in forex:
Is ABCD a bullish or bearish chart pattern?
Like some other chart patterns, ABCD is a chart pattern that could be either bullish or bearish. It is a formation found on trading charts that may appear on both sides and signals a buying or selling opportunity.
How to identify the ABCD harmonic candle pattern?
The easiest way to identify the ABCD pattern is to look for three price swings in any trend direction, creating a zigzag shape. In case you can identify a valid ABCD pattern with four points and three lines where the AB leg is larger than BC and equal to CD – then you can draw the ABCD pattern and look for the appropriate Fibonacci numbers (AC is 61.8% of AB, and BD is 127.2% of BC).
How to draw the ABCD pattern on a price chart?
Frankly, perhaps the most challenging part of using the ABCD trading pattern is to draw it on a price chart. Obviously, measuring the numbers independently is not something you can do regularly, and drawing the lines is not ideal as well. For that reason, you can simply use a built-in indicator on your trading platform, set the numbers, and automatically draw the ABCD pattern to a chart.
Risk Disclosure: The information provided in this article is not intended to give financial advice, recommend investments, guarantee profits, or shield you from losses. Our content is only for informational purposes and to help you understand the risks and complexity of these markets by providing objective analysis. Before trading, carefully consider your experience, financial goals, and risk tolerance. Trading involves significant potential for financial loss and isn't suitable for everyone.