How to Use Multiple Time Frames in Forex Trading
Ok, we get it, maybe you’re not a big fan of the idea of flipping through a million different time frames while trying to analyze just one… just one… currency pair. After all, sometimes it’s hard enough to analyse just one chart…
However, using multiple time frames can improve your trading and help you see the big picture. Well, rather than me trying to convince you why you should be using multi time frame analysis to trade the forex market, let’s play a popular Forex game called “Long or Short” to show why you should be paying attention and putting in the extra effort to look at different time frames.
Multiple Time Frame Analysis in Forex Trading
The rules are easy. You look at a chart and decide whether to go long or short. Easy enough, right? Okay, ready?
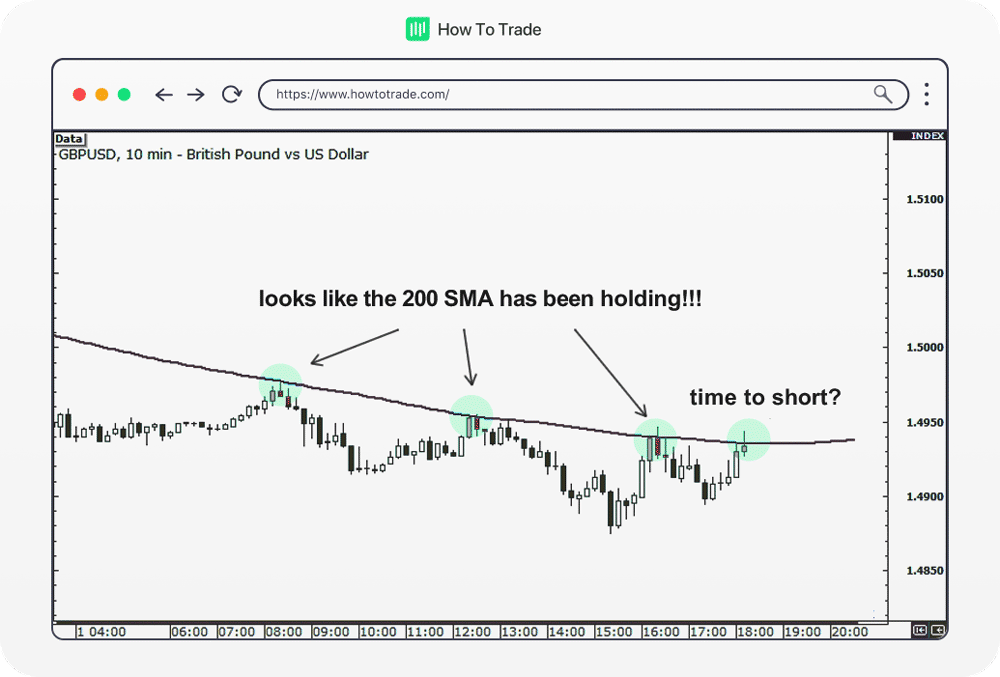
Let’s take a look at the 10-minute time frame chart of GBP/USD. We’ve got the 200-period simple moving average (SMA) technical analysis indicator on the chart, which appears to be holding as a resistance level.
With price testing the resistance and forming a Doji candlestick pattern, it might be a good time to go short right?

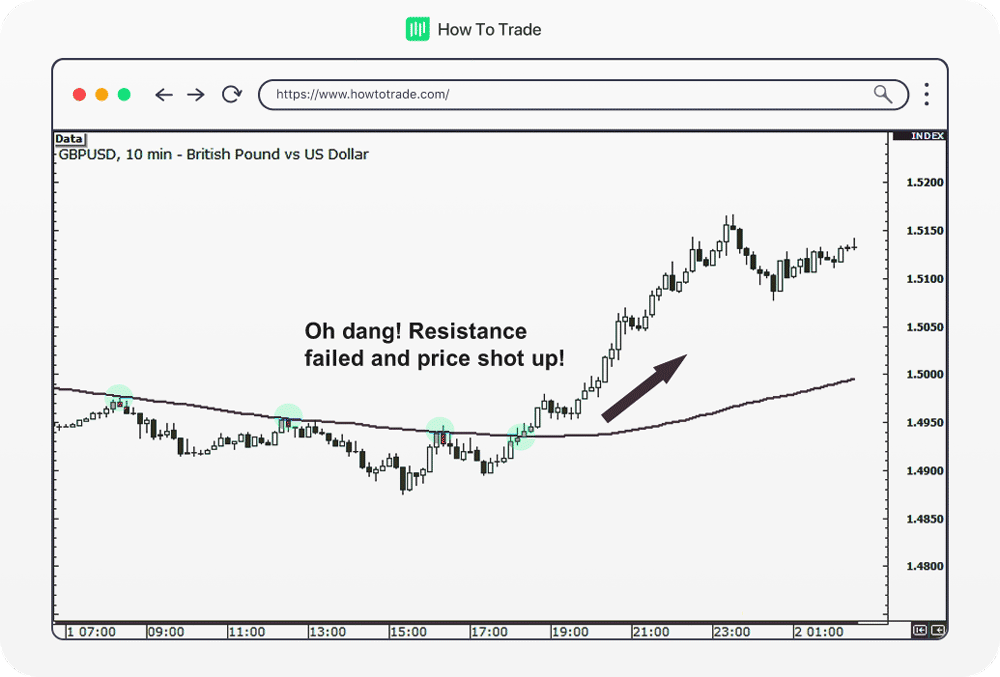
But, let’s take a closer look at what happened next! We are still looking at the 10-min chart time frame – The pair closed above resistance and rose another 200 pips! Whoops! Oh well, too bad!

What did the hell happen?
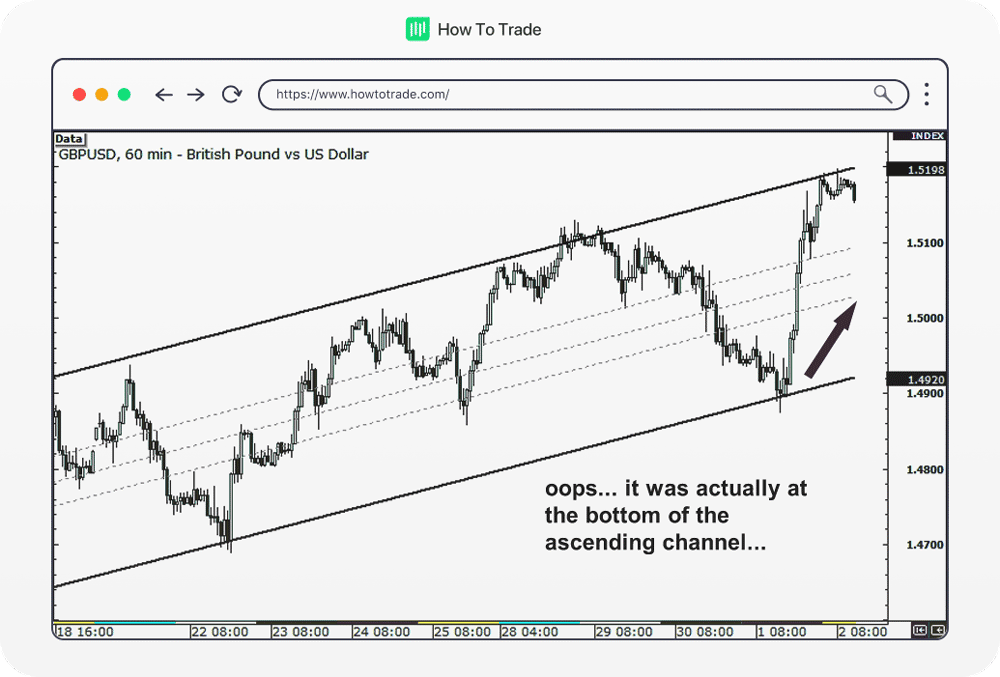
Well, let’s flip to the 1-hour chart to see… The truth is, if you had been looking at the 1-hour chart, you would have noticed that the pair was actually trading at the bottom of the ascending channel. Even more, a Doji had formed right smack on the support line! A clear buy signal!

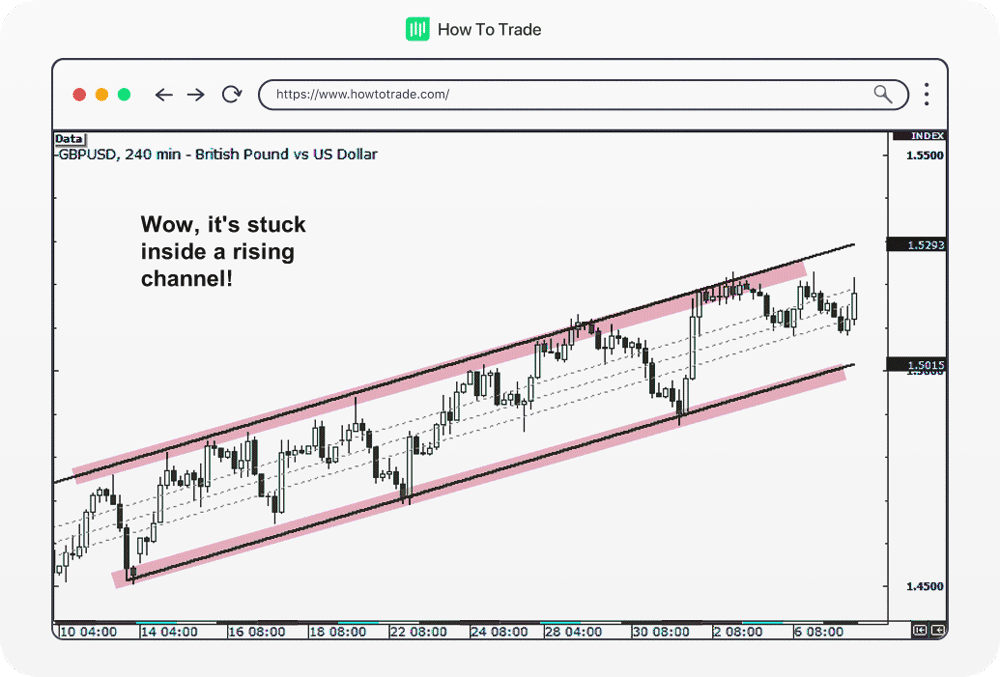
That is multiple time frame analysis. Instead of looking at a one-time frame, you are using several time frames so you can realize what is the overall trend in the market. And guess what… It would have been even clearer on the four-hour chart. Take a look.

If you had looked at these charts first, would you still have been so quick to go short when you were trading on the 10-minute chart? Probably not. And that’s why it is super important to look at different time frames and use multiple time frame analyses.
Tips on Trading Multiple Time Frames in Forex
As you can see from the example above, multiple time frame analysis can be a very powerful method to capture the market sentiment of a particular currency pair. So, here are a few suggestions for you to get the best out of this trading strategy:
Top-down approach
Perhaps the most important and effective multiple time frame analysis approach of all is the top to down analysis. With this method, you start on the higher time frame and slowly go down to a lower time frame. The reason – is very simple. When you start with higher time frames, you get a quick overview of the big picture and the price action over the last weeks or even months. So, many traders start with a monthly or weekly chart, then continue to daily charts, and then finish their multiple time frame analysis with very short period charts (four hours chart, 1-hour chart, 30-minute chart, 15-minute chart, or 5-minute chart).
Find your preferred trading time frame
Every forex trader that uses technical analysis has a preferred time frame. Some forex traders usually look at a 1-hour chart while others focus on a 5 minutes time frame.
Obviously, the best time frame for you to use also depends on your trading style and trading technique. Day traders, for instance, usually use lower time frames to manage their trades (5 min chart to 4-hour chart). Swing traders use intermediate time frame analysis, which includes a daily chart time frame, four-hour time frame, and 1-hour time frame.
Most traders typically stick to a one-time frame chart. Let’s say you decide to use a 15-minute time frame chart and you open 4 charts of different currency pairs on your MT4 charting software. This means the 15-min chart is your preferred trading time frame so once you have a trade entry point, you use the 15-minute chart as your benchmark chart and use the top-down approach we mentioned above.
Stick to up to 2-3 time frames
As a general rule – like any other aspect of life, do not overdo things. We would recommend you use at least TWO, but not more than three-time frame charts. Especially, as you’re just starting up. Adding more time frame charts will confuse the hell out of you and you’ll suffer from analysis paralysis (it’s a thing), then proceed to go crazy.
Always look for support and resistance levels
No matter what time frame charts you will use, always look for support and resistance levels. As proven in the example above, in many cases, you can’t identify some key levels in a single time frame. For that matter, use the top-down multi-timeframe analysis by analyzing a weekly or daily time frame chart. In case you find a support or resistance level, go back to your low time frame chart and draw these crucial levels.
Key takeaways
Regardless of the trading strategy or trading style you have adopted, using multiple time frame analysis will allow you to see things clearly because you’re able to identify where you are relative to the BIGGER PICTURE. And to be completely honest with you, trading using multiple time frames has probably kept me out of more losing trades than any other one thing alone.
There is obviously a limit to how many time frames one can study. I mean, you don’t want a screen full of charts all telling you different things. Instead, make it simple. Use the top-down approach to first realize the market sentiment over the past several weeks. For that, you need to start analyzing larger time periods prior to short time periods. But really, there’s no need to use more than three charts.
At the end of the day, it really is all about finding the trading strategies that work best for YOU so go ahead, open up that chart, and get started! In the next lesson, we’ll teach you how to trade forex pairs with three-time frames.
In partnership with our recommended partner
Wait!
"Join our Trade Together program and interact with us in real-time as we trade the markets together."


