There are over 20 top chart patterns, and knowing everything about each of them can be challenging, especially if you’re just beginning your trading journey. That’s what this chart pattern cheat sheet helps you to solve. With it, you can see a formation playing out on the chart and easily refer to the cheat sheet to know what it is and how to trade it.
What is a Chart Pattern Cheat Sheet?
A chart pattern cheat sheet is a document or image that contains brief references to chart patterns, how to identify them, and how to trade them. It’s best for beginner traders who want to learn to use chart patterns on the fly.
Free Chart Patterns Cheat Sheet PDF Download
Here’s our free chart patterns cheat sheet PDF containing the most popular and widely used trading patterns among traders. You can download and print it and stick it on your desktop or save it in a folder and use it whenever needed.

Chart Patterns Cheat Sheet PDF [Download]
3 Types of Chart Patterns
There are three types of chart patterns, depending on what the pattern predict
1. Continuation Chart Patterns
Continuation patterns signal that the existing trend is likely to continue. Typically, when traders spot a continuation chart pattern, it allows them to enter a trade and join the current trend.
Here are the top continuation patterns:
| Pattern | Bias | Appears During |
| Bullish Flag Pattern | Bullish | Bullish Trend |
| Bearish Flag Pattern | Bearish | Bearish Trend |
| Bullish Pennant | Bullish | Bullish Trend |
| Bearish Pennant | Bearish | Bearish Trend |
| Rising Wedge | Bearish | Bearish Trend |
| Falling Wedge | Bullish | Bullish Trend |
| Ascending Triangle | Bullish | Bullish Trend |
| Descending Triangle | Bearish | Bearish Trend |
Bullish Flag Pattern
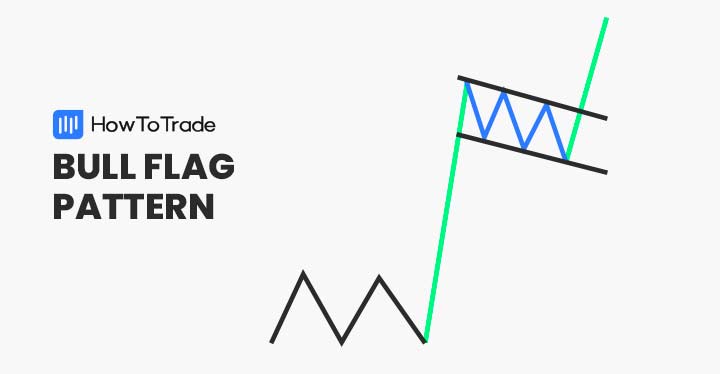
A Bullish Flag is a continuation pattern that forms after a strong upward price movement (the flagpole). This flagpole comes before a brief consolidation phase where price trends downward or sideways within parallel trendlines (the flag).
Bearish Flag Pattern
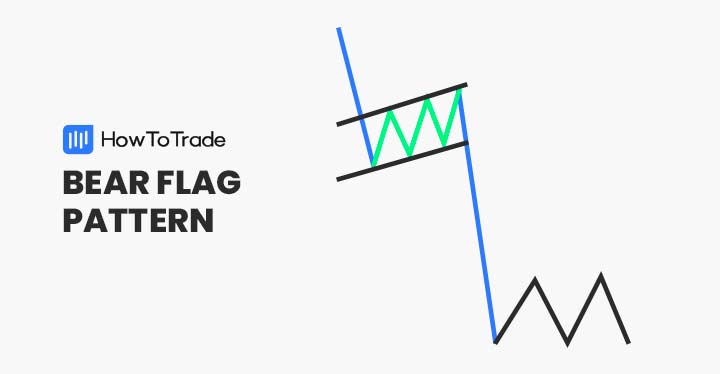
A Bearish Flag is a continuation pattern that forms after a sharp downward price movement (the flagpole). After this flagpole comes a short consolidation phase, often characterized by low volume, where price trends upward or sideways within parallel trendlines (the flag).
Learn more about the Bearish Flag Pattern here:
Bullish Pennant Pattern
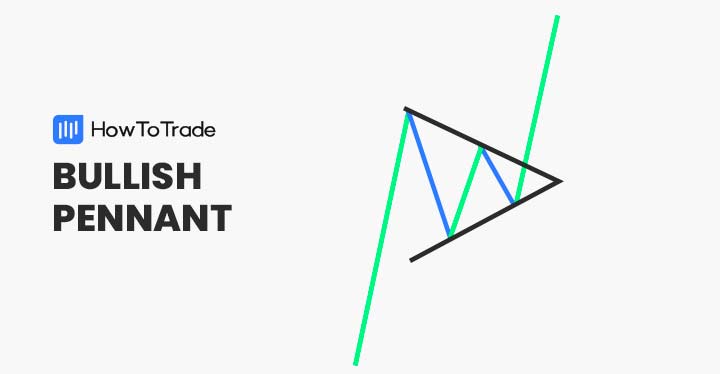
A Bullish Pennant is a continuation pattern that forms after a strong upward price movement (the flagpole). A small symmetrical triangle-like consolidation phase with converging trendlines then follows this.
Bearish Pennant Pattern
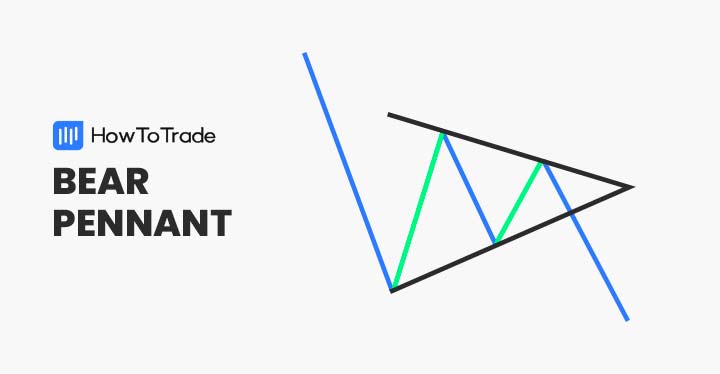
A Bearish Pennant is a continuation pattern that forms after a strong downward price movement (the flagpole). After this strong movement comes a small symmetrical triangle-like consolidation phase with converging trendlines.
Learn more about the Bearish Pennant Pattern here:
Ascending Triangle pattern

An Ascending Triangle is a bullish continuation pattern characterized by a horizontal resistance line and a rising trendline. The pattern forms as the price makes higher lows while repeatedly testing the resistance level.
Descending triangle pattern

A Descending Triangle pattern is a bearish continuation pattern characterized by a flat lower support line and a downward-sloping upper resistance line that converge as the pattern develops. It typically forms during a downtrend as sellers become increasingly aggressive while buyers remain consistent at a specific price level.
2. Reversal Chart Patterns
Reversal patterns are chart formations that indicate a change in direction from a bearish to a bullish market trend and vice versa. These trend reversal patterns appear before a new trend begins and signal that the price action trading will likely move in the opposite direction.
These are some of the most commonly used reversal patterns:
| Pattern | Bias | Appears During |
| Double Top | Bearish | Bullish Trend |
| Double Bottom | Bullish | Bearish Trend |
| Triple Top | Bearish | Bearish Trend |
| Triple Bottom | Bullish | Bearish Trend |
| Rising Wedge | Bearish | Bullish Trend |
| Falling Wedge | Bullish | Bearish Trend |
| Head and Shoulders | Bearish | Bullish Trend |
| Inverted Head and Shoulders | Bullish | Bearish Trend |
| Diamond Bottom | Bullish | Bearish Trend |
| Diamond Top | Bearish | Bullish Trend |
Double Top
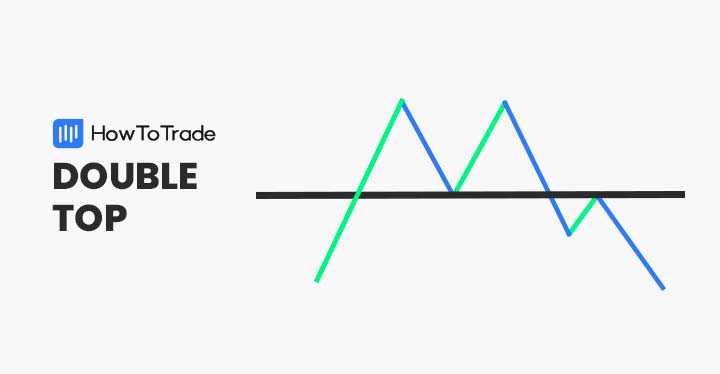
The double-top pattern is a bearish reversal pattern that is characterized by the appearance of two relatively equal highs with a low in between. The pattern comes up during a bullish trend and prices.
The psychology behind this bearish pattern is that the bulls have failed to break through resistance from the bears. And as such, the bears are taking over the trend.
Double Bottom
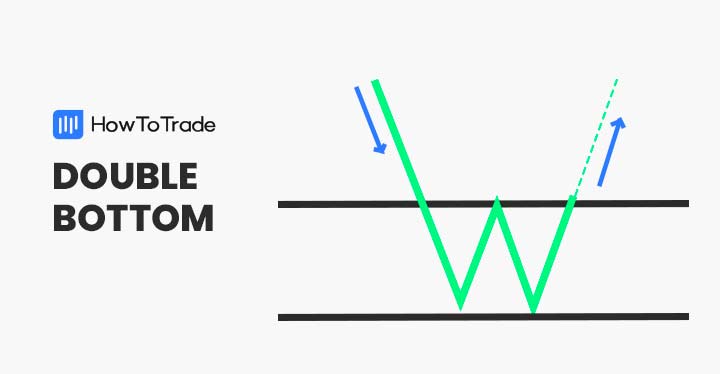
The double bottom is a bullish reversal pattern that appears when the price forms two relatively equal lows with a peak in between, looking like a “W.” This bullish pattern forms in a downtrend and suggests that the bears have failed to break through a certain support level on two tries, which is a sign that the bulls are holding firm. As such, the bets are on the bulls to take the baton from the bears and push the price upward.
Triple Top

The triple-top is a bearish reversal pattern that appears during a bullish trend. It is characterized by three relatively equal highs with two lows in between consecutive highs. This is a strong pattern that suggests that the bulls are unable to push the price past a certain point before getting exhausted and surrendering control to the bears.
Learn more about the Triple Top Pattern here:
Triple Bottom
A triple bottom is a bullish reversal pattern that forms after a downtrend. It features three distinct lows at a relatively equal price level, separated by minor peaks. You get the confirmation of the pattern when the price breaks above the resistance formed by the peaks, signaling a potential uptrend.
Learn more about the Triple Bottom Pattern here:
Rising Wedge
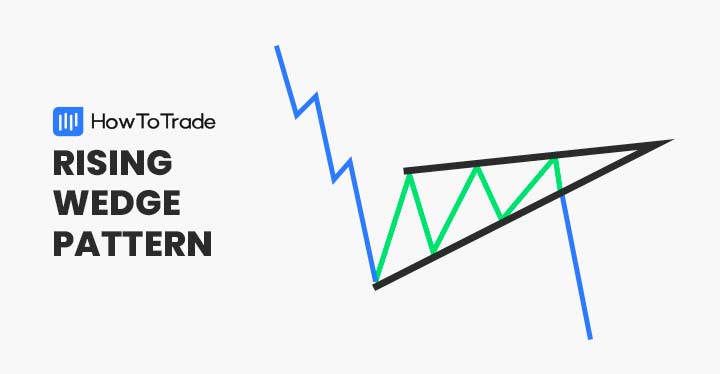
A rising wedge is a bearish reversal pattern that forms when the price moves upward within converging trendlines. The highs and lows both trend higher, but the slope of the lows is steeper, indicating weakening momentum.
The pattern signals a potential downtrend, and you can look to trade it once the price breaks out of the wedge from the bottom.
Learn more about the Rising Wedge Pattern here:
Falling Wedge
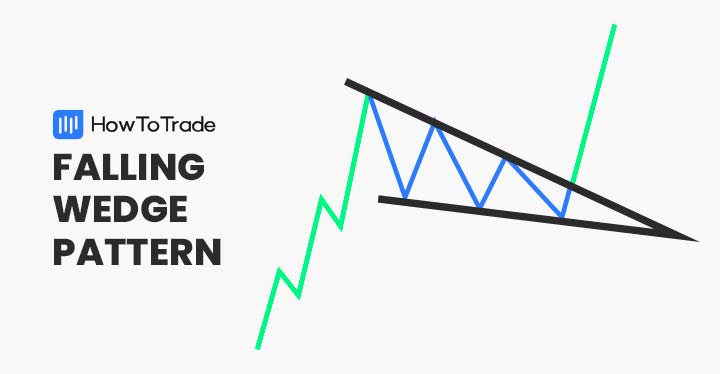
A falling wedge is a bullish reversal pattern that forms when the price moves downward within converging trendlines. The highs and lows both trend lower, but the slope of the highs is steeper, indicating a weakening bearish momentum.
Learn more about the Falling Wedge Pattern here:
There’s something interesting about the wedge patterns, and it has to do with the prevalent trend before their appearance. If the trend rising wedge appears in a bullish trend, it is a reversal pattern. But if it occurs during a bearish trend, it’s a continuation pattern. Similarly, if the falling wedge appears during a bullish trend, it’s a continuation pattern. But if it appears during a downtrend, it’s a reversal pattern.
Head and Shoulders
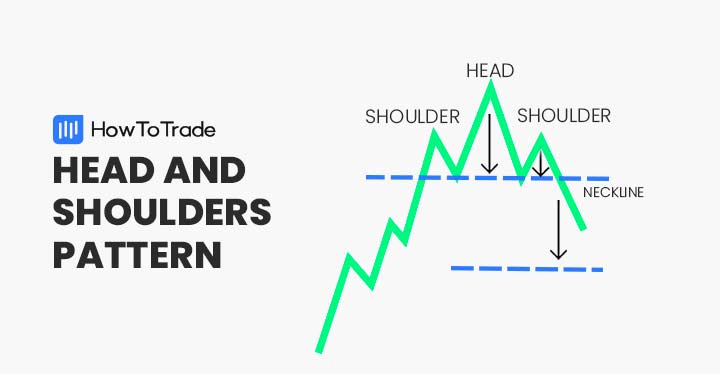
A Head and Shoulders pattern is a bearish reversal formation consisting of three peaks, with the middle peak (head) higher than the two surrounding peaks (shoulders). The pattern forms after an uptrend and signals a potential trend reversal.
Learn more about the Head and Shoulders Pattern here:
How to Trade The Head and Shoulders Pattern (Trading Example)
Inverted Head and Shoulders
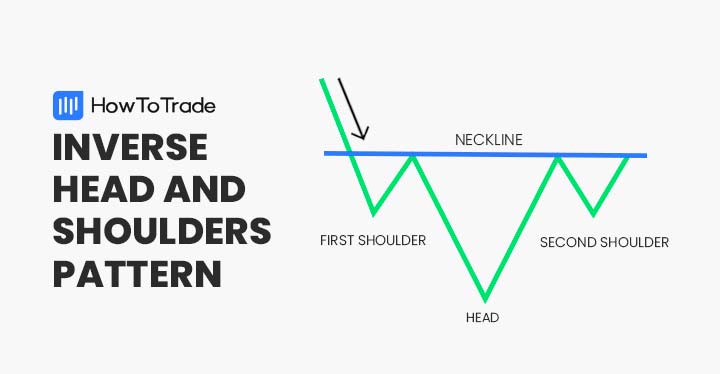
An Inverted Head and Shoulders pattern is a bullish reversal formation consisting of three troughs, with the middle trough (head) lower than the two surrounding troughs (shoulders). The pattern forms after a downtrend and signals a potential trend reversal.
Learn more about the Inverted Head and Shoulders Pattern here:
The Inverse Head and Shoulders Pattern: Definition and Trading Example
Diamond Bottom
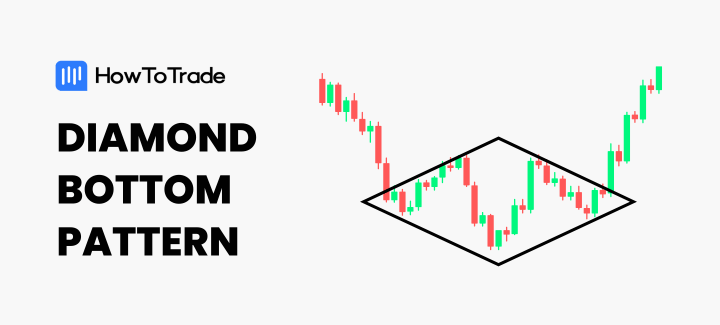
A Diamond Bottom is a bullish reversal pattern that forms after a downtrend. It begins with a widening price action and then a narrowing movement. This then creates a diamond-like shape. The bullish breakout of the pattern after this broadening and narrowing is what you’ll look to trade.
Diamond Top
A Diamond Top is a bearish reversal pattern that forms after an uptrend. It starts with a widening price action, followed by a narrowing movement, creating a diamond-like shape. You may look to trade it when the price breaks below the lower support line on the narrowing half.
Learn more about the Diamond Top Pattern here:
We have a more comprehensive list of reversal chart patterns. Do check them out here:
The 14 Most Common Reversal Chart Patterns in Trading
3. Bilateral Chart Patterns
Bilateral chart patterns indicate that the price will likely move in either direction. In other words, they can be bullish chart patterns or bearish chart patterns, depending on the scenario. Here are some of the most common bilateral chart patterns:
Symmetrical Triangle Pattern
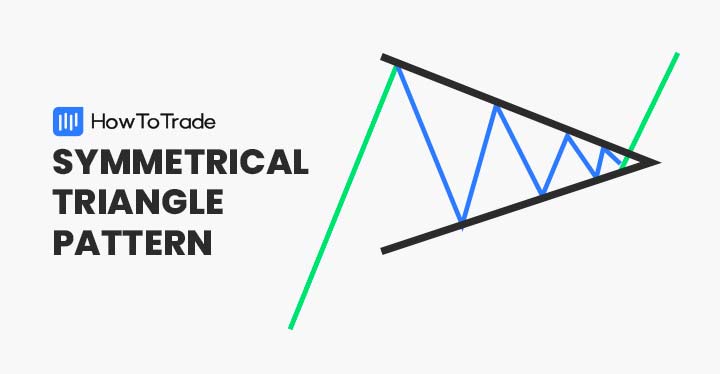
A Symmetrical Triangle is a pattern characterized by converging trendlines with lower highs and higher lows. This pattern indicates consolidation, where neither buyers nor sellers dominate. As a result, the breakout could occur in any direction.
Broadening Formation Pattern
A Broadening Formation is a pattern characterized by diverging trendlines with higher highs and lower lows, indicating increasing volatility. It reflects market uncertainty and often lacks a clear directional bias. The pattern confirms when the price breaks out either above the upper trendline or below the lower trendline, signaling a potential continuation or reversal.
How to Use a Chart Pattern Cheat Sheet
Now that you know these chart patterns, how do you use this cheat sheet to your advantage? Follow the following steps:
1. Compare and Contrast
Whenever you see something that looks like a pattern forming on your chart, go to your cheat sheet to see if any pattern matches what’s on your chart.
2. Identify the trend
Next, identify the trend of the pattern on your chart. This is important because this may determine whether you’ll have a bullish or bearish bias. Now, compare again with what you have on your cheat sheet. If the cheat sheet says the pattern should form in a bearish trend, but your chart has the pattern forming in a bullish trend, don’t take the trade.
3. Confirm Broader market context
The broader market context will always hold a significant influence on the ultimate direction of the price. So, in a bullish market, only try to go for bullish continuation and reversal patterns, and vice versa for a bearish market.
This is not to say, however, that you can’t trade against a prevalent trend. You can, but this takes a little more expertise.
Common Mistakes to Avoid When Using Chart Patterns
Many traders make these mistakes when trading chart patterns:
1. Neglecting the Larger Market Context
Chart patterns appear anywhere and everywhere. However, what confirms them is the larger market context in which they appear. If the market has been bullish on a higher timeframe, for instance, it can be dangerous to try to trade a bearish reversal pattern. Of course, it is still possible to be profitable with this counter-trend trade, but it takes a lot of practice.
2. Ignoring volume
Chart patterns form due to the tussle between the bulls and the bears. And the volume chart represents the strength with which each side is fighting. When you ignore volume, you cannot tell the force or magnitude behind each move, and that could leave your strategy bereft of trading depth.
3. Forcing Patterns to Fit
Sometimes, the pattern you’re hoping is forming just isn’t it. You’ll know you’re already forcing a pattern to fit when you find yourself constantly adjusting the trendlines to fit perfectly but still can’t find the right balance.
If the pattern doesn’t fit, don’t force it.
Over To You
In summary, mastering the art of chart patterns can help you become a better trader and understand how financial markets work.
These repeated patterns, often called stock chart patterns or Forex chart patterns, along with the integration of other technical indicators, will allow you to estimate the market sentiment and predict the next price movement. And, as remembering all the chart patterns can be quite tricky for some traders, a cheat sheet is an excellent and straightforward way to do that, especially at the beginning of your trading journey. We also suggest you download or an advanced candlestick patterns cheat sheet.
Chart Patterns Cheat Sheet Frequently Asked Questions
Here are some frequently asked questions about chart patterns.
Are Chart Patterns Reliable?
Chart patterns are reliable only when used in context and in conjunction with other trading tools and concepts. No chart pattern is reliable when used in isolation.
What Timeframe is best for Chart Patterns?
The higher timeframes, such as the 4-hour and the daily, tend to have more reliable chart patterns than the lower timeframes. However, no chart pattern is infallible. Approach each pattern with caution and only trade it when it aligns with your broader market context.
Risk Disclosure: The information provided in this article is not intended to give financial advice, recommend investments, guarantee profits, or shield you from losses. Our content is only for informational purposes and to help you understand the risks and complexity of these markets by providing objective analysis. Before trading, carefully consider your experience, financial goals, and risk tolerance. Trading involves significant potential for financial loss and isn't suitable for everyone.