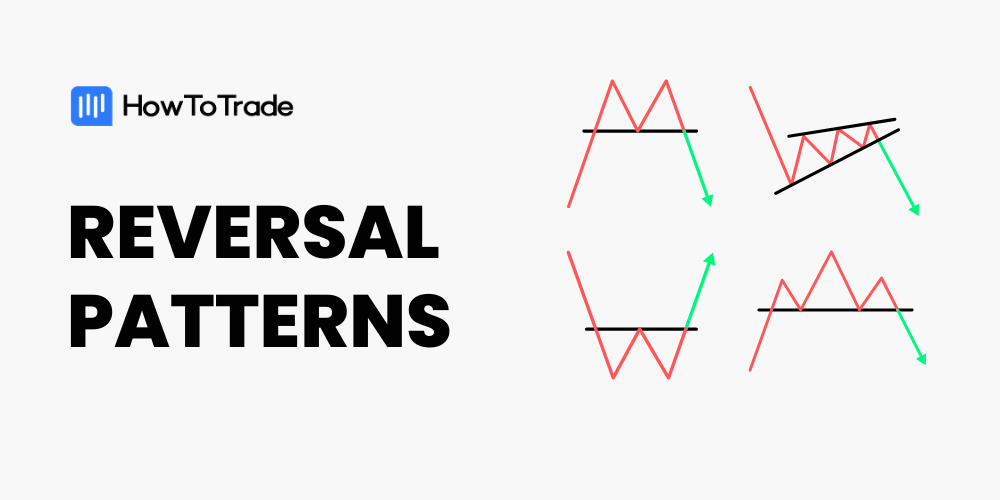
- Reversal patterns hint you when a trend is likely coming to an end, and another is beginning
- There are many reversal chart patterns. We mention only 14 most used here, but there are more.
- Before you trade these reversal patterns, there are some things you must consider, such as the overall market trend on a higher timeframe.
The forex market chart moves in uptrends and downtrends. But do you know that these movements are not always random? Some factors cause movements, and the market will often give you signs before changing trends. These signs are called reversal chart patterns.
If you know how to spot them and trade them, reversal chart patterns can help you make sure that you catch new trends right at the top.
In this piece, you’ll learn:
- What reversal chart patterns are
- The top 12 reversal patterns you ought to know
- And common mistakes to avoid when trading reversal chart patterns.
What are Reversal Chart Patterns?
Reversal chart patterns indicate a potential change in the current trend, signaling that the prevailing trend is about to reverse. Trend reversal patterns can form at market tops or market bottoms. Those that form at market tops indicate a potential shift from a bullish to a bearish trend, and those that form at market bottoms suggest a possible change from a bearish to a bullish trend.
If you’re late to the trend, you’re not necessarily too late to the party. There are continuation patterns with which you can catch trend continuations.
What are the Top 14 Reversal Chart Patterns in Trading?
Without wasting any time, let’s see 14 reversal chart patterns with which you can catch the end of old trends and the beginning of new trends:
1. Head and Shoulders Pattern
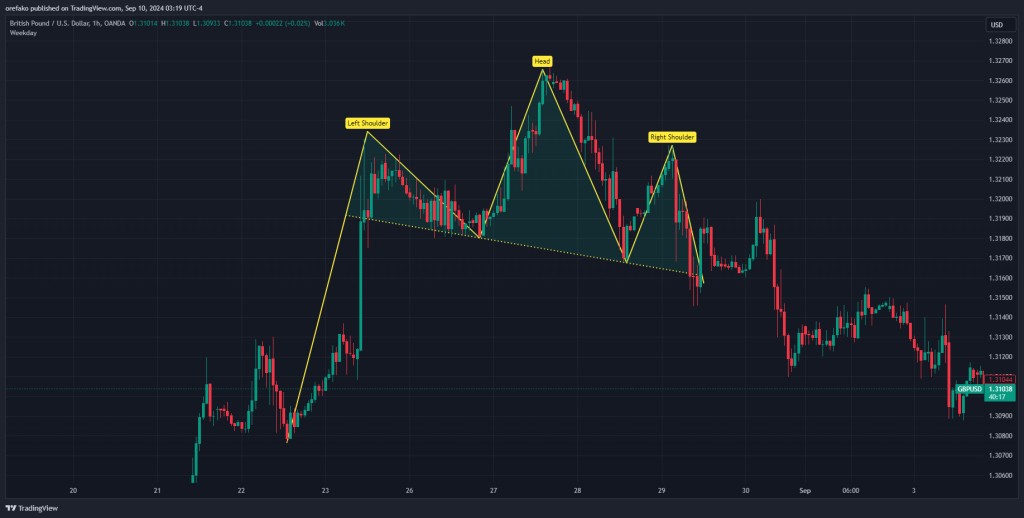
The Head and Shoulders pattern is one of the most well-known reversal patterns in Forex. It consists of three peaks: the middle peak (the head) being the highest, flanked by two smaller peaks (the shoulders) on either side. The line connecting the low points of the two shoulders is called the neckline.
This pattern typically forms at the top of an uptrend and signals a bearish reversal. To trade this pattern, you’ll look for a break below the neckline as a confirmation of the reversal. And you can use the height of the head from the neckline to project your potential downside target.
2. Inverse Head and Shoulders Pattern
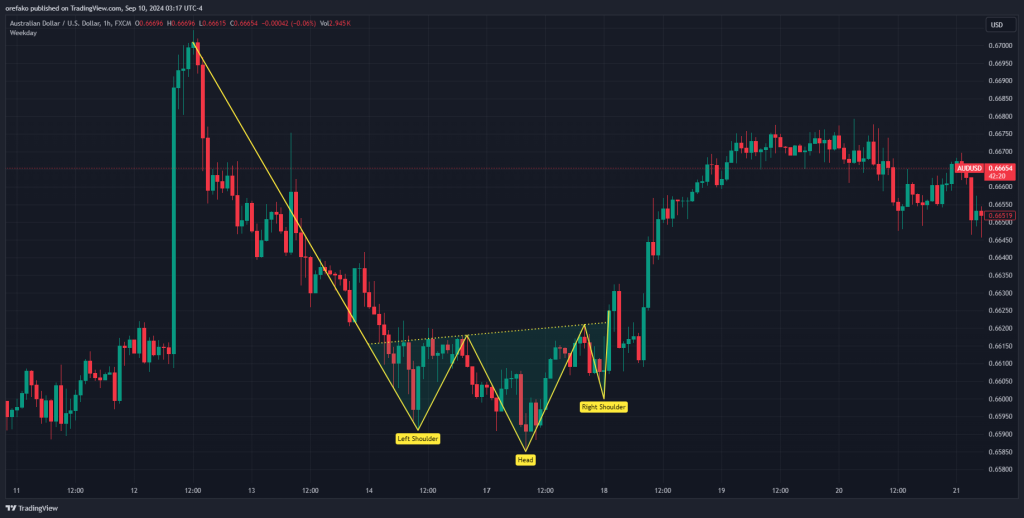
The Inverse Head and Shoulders is the bullish counterpart to the Head and Shoulders pattern. It forms at the end of a downtrend and consists of three lows, with the middle low going deeper than the other two that flank it. The middle low is the head, and the lows on either side are the shoulders. The neckline connects the highs of the shoulders.
A breakout above the neckline confirms the pattern, suggesting a bullish reversal. Your projected target can be estimated by measuring the depth of the head from the neckline.
3. Double Top Pattern
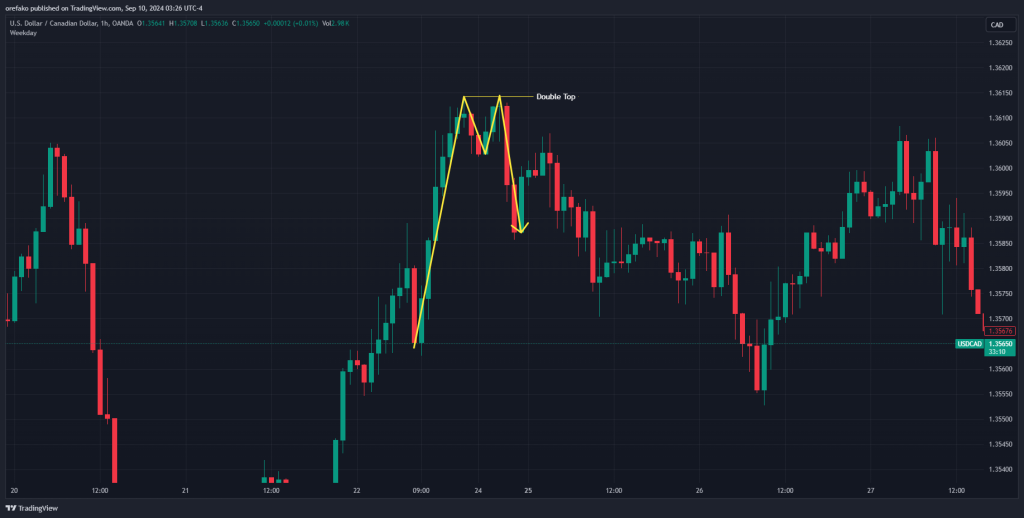
The Double Top is a bearish reversal pattern that appears after a strong uptrend. It consists of two peaks at roughly the same level, with a trough in between. The double top confirmation comes when the price breaks below the support line, drawn through the trough between the peaks. This indicates that the buying pressure is weakening, and a bearish reversal is likely.
When trading this pattern, you can place your entry at the retracement to the support line and target the same distance as the height of the peak of the pattern to the support line.
4. Double Bottom Pattern
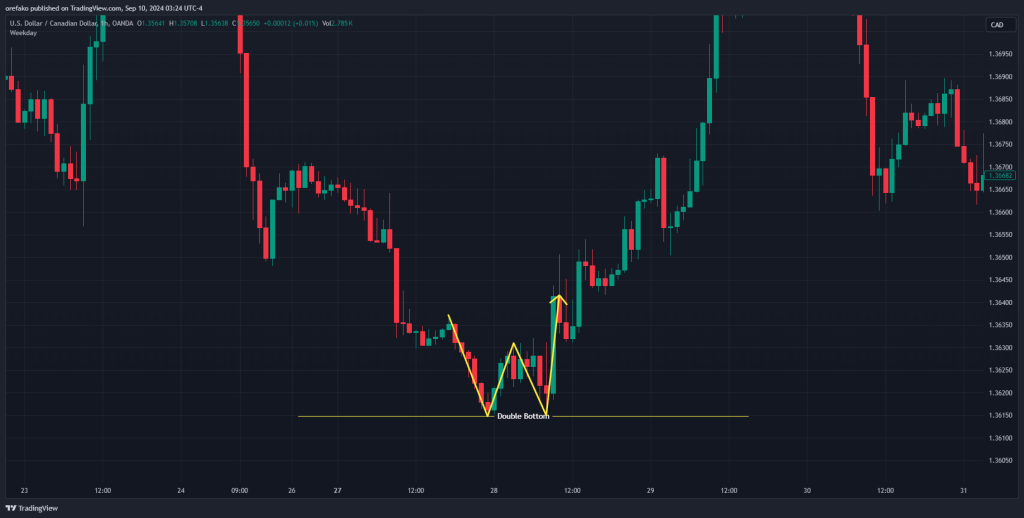
The Double Bottom is the bullish counterpart of the Double Top and signals a reversal of a downtrend. It consists of two lows at nearly the same level, with a high in between. The pattern is confirmed when the price breaks above the resistance line drawn through the peak between the troughs.
This breakout suggests that buying interest is returning, and a bullish reversal is underway. You can gauge the potential upside by measuring the height from the lows to the resistance line.
5. Triple Top Pattern
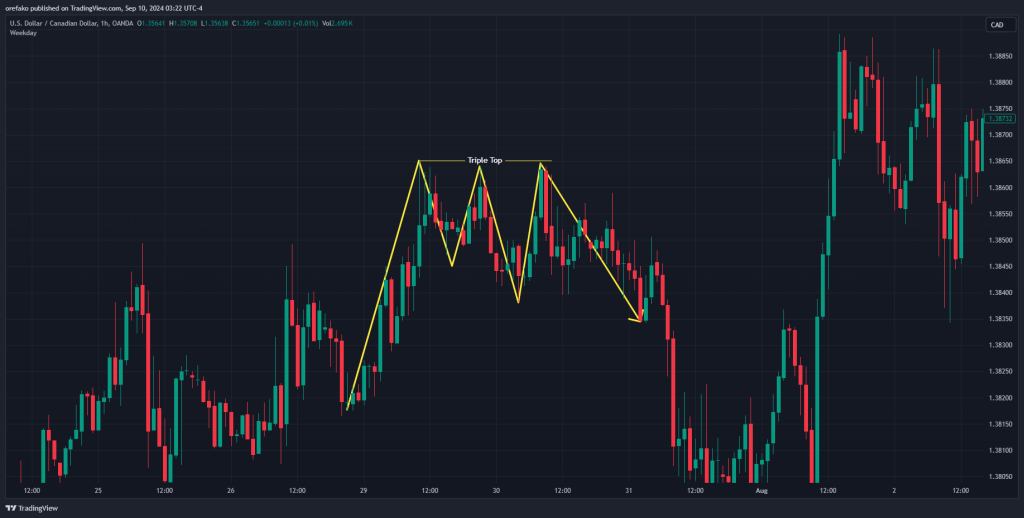
The Triple Top is a bearish reversal pattern, similar to the Double Top, but with three highs at approximately the same level. This pattern indicates that the market is struggling to break higher, and the buying momentum is weakening.
When the price breaks below the support line connecting the lows with the highs, you get a confirmation of the pattern. You can place your entry at the retracement of this support line and look to take profit at the same distance as the height of the support line.
6. Triple Bottom Pattern
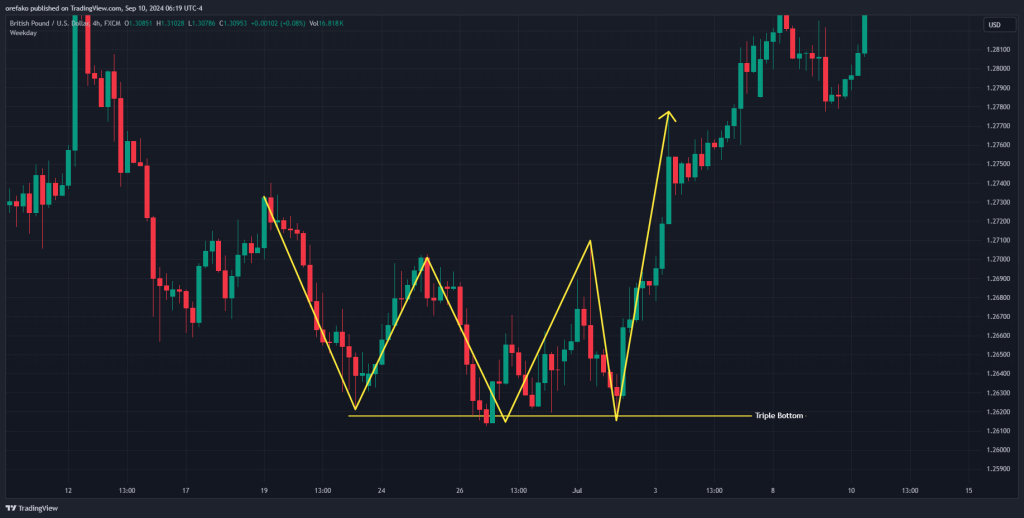
The Triple Bottom is a bullish reversal pattern with three lows at roughly the same level. It indicates that selling pressure is diminishing, and buyers are gaining control. A bullish reversal is confirmed when the price breaks above the resistance line connecting the peaks between the troughs. The potential upside can be projected by measuring the height from the troughs to the resistance line.
7. Rising Wedge Pattern
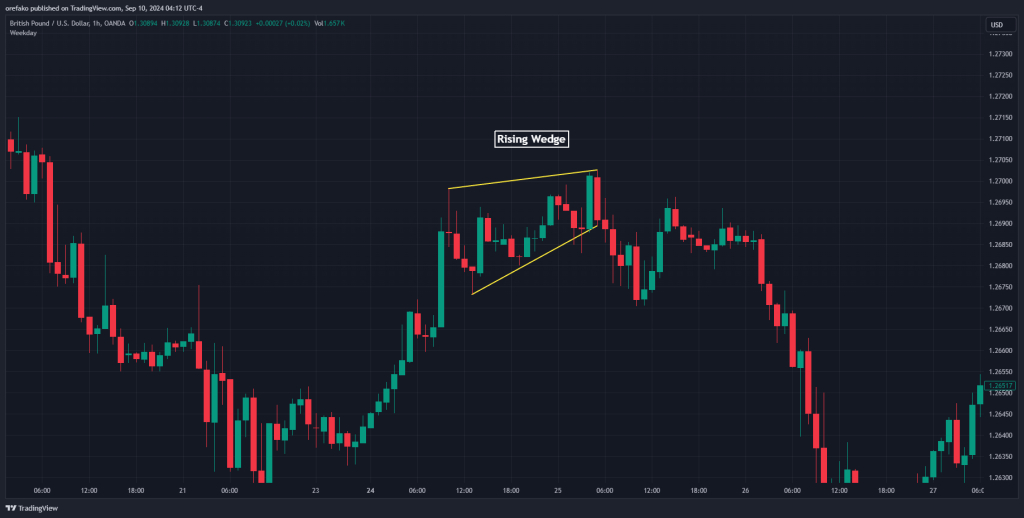
The Rising Wedge is a bearish reversal pattern that can appear during uptrends or downtrends but typically signifies a reversal when it forms after a sustained uptrend. It is characterized by converging trendlines, where both the upper and lower lines slope upwards, but the lower line rises more steeply. This pattern indicates that the buying pressure is waning, and a bearish reversal is likely. The pattern is confirmed when the price breaks below the lower trendline.
8. Falling Wedge Pattern
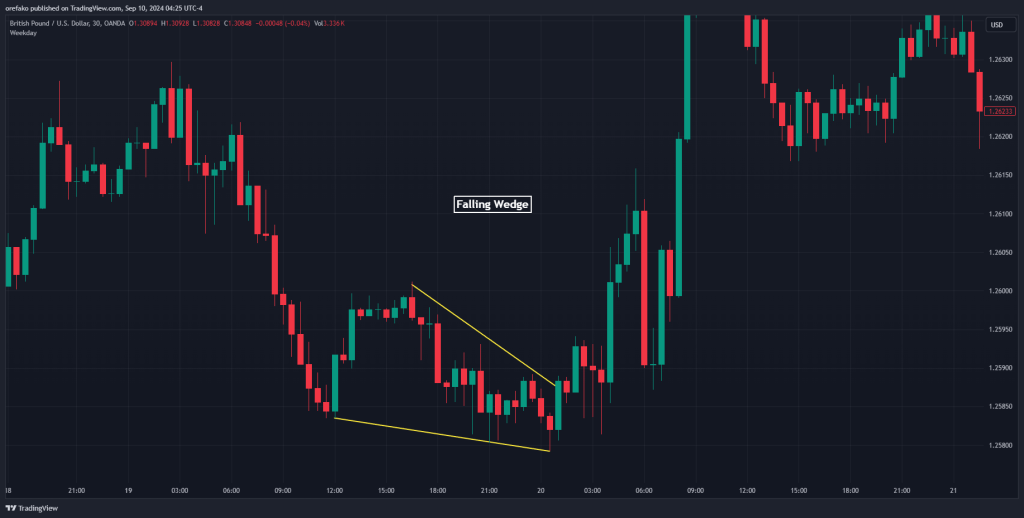
The Falling Wedge is a bullish reversal pattern that can occur during downtrends or uptrends but typically signals a reversal when it forms at the end of a downtrend. It features converging trendlines sloping downwards, with the upper line descending more steeply than the lower line. This pattern suggests that selling pressure is decreasing, and a bullish reversal is likely. A breakout above the upper trendline confirms the pattern.
9. Rounding Top Pattern
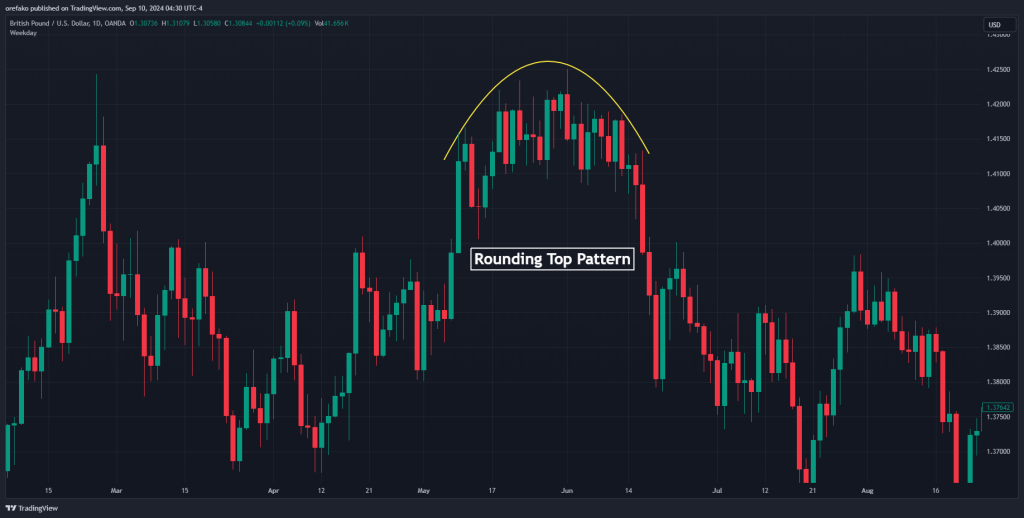
The Rounding Top is a bearish reversal pattern that indicates a gradual shift from bullish to bearish sentiment. It appears as a smooth, rounded curve at the top of an uptrend, reflecting a steady decrease in buying interest. This pattern suggests that the trend is losing momentum, and a bearish reversal is likely. The reversal is confirmed when the price breaks below the support level at the base of the rounding top.
10. Rounding Bottom Pattern
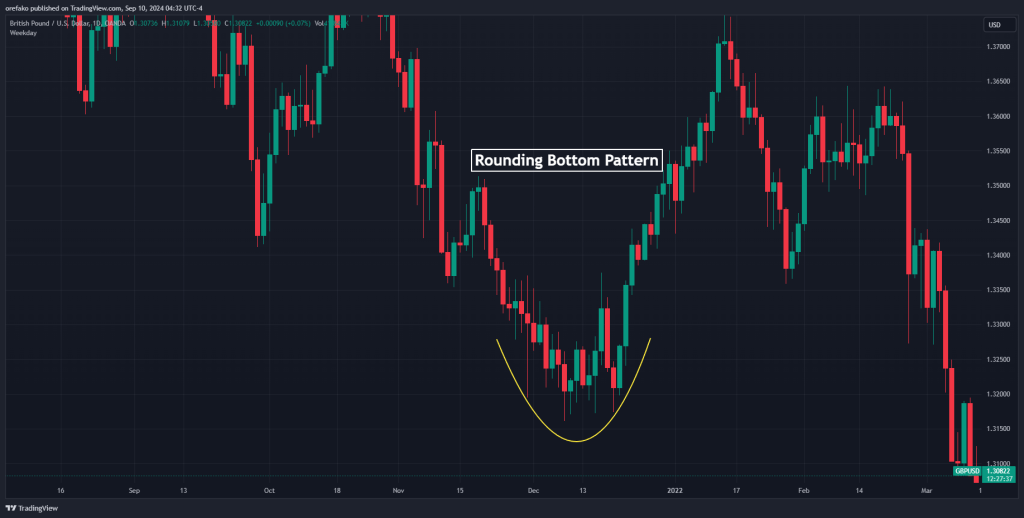
The Rounding Bottom, also known as a saucer bottom, is a bullish reversal pattern that shows a slow and steady shift from bearish to bullish sentiment. It appears as a rounded curve at the bottom of a downtrend, indicating a gradual decrease in selling pressure and a potential reversal to the upside. The pattern is confirmed when the price breaks above the resistance level at the top of the rounding bottom.
11. Diamond Top Pattern
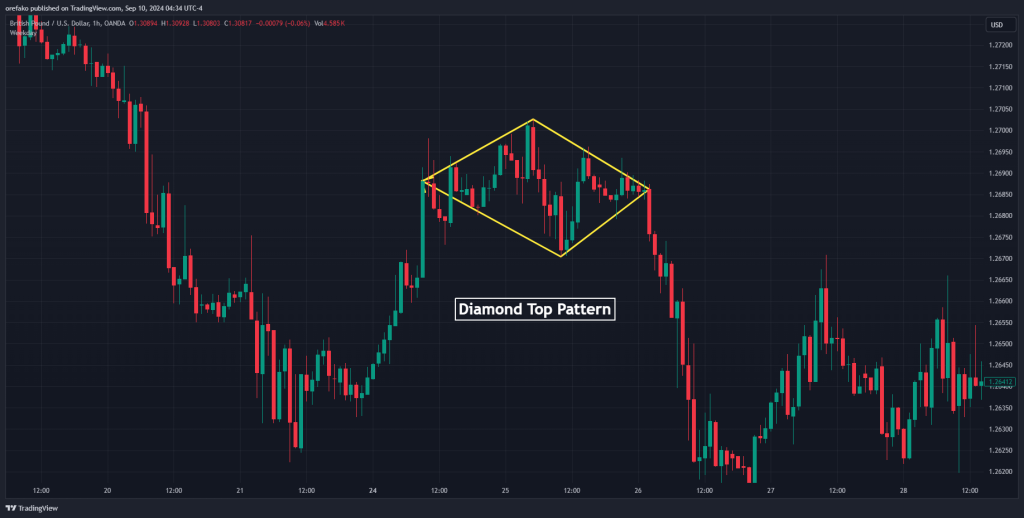
The Diamond Top is a bearish reversal pattern that resembles the shape of a diamond. It typically forms at the end of an uptrend and signals that the upward momentum is losing steam. The pattern starts with a broadening formation followed by a contracting formation, creating the diamond shape. It reflects increased volatility as buyers and sellers struggle for control.
When the price breaks past the lower boundary of the diamond, the pattern is confirmed, and you can look to sell it. Ideally, you’ll look to take profit at the same distance as the height of the diamond at its widest point.
12. Diamond Bottom Pattern
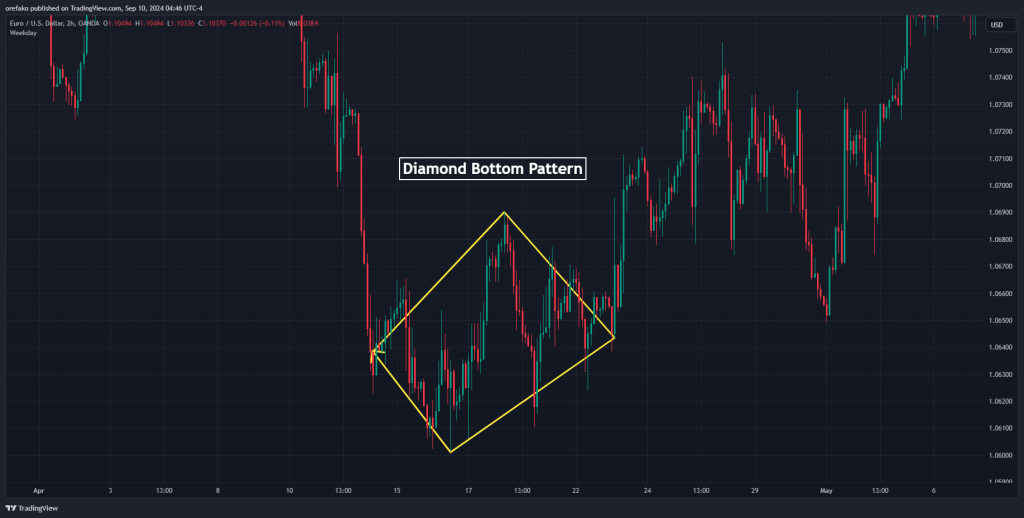
The Diamond Bottom is the bullish counterpart of the Diamond Top, appearing at the end of a downtrend. It forms when the price action starts with a broadening formation, followed by a contracting formation, creating a diamond shape. This pattern signals a potential reversal from a downtrend to an uptrend.
You get a confirmation of this pattern when the price breaks above the upper boundary of the diamond. Your upside target will ideally be estimated by measuring the height of the diamond at its widest point.
13. Island Reversal Pattern
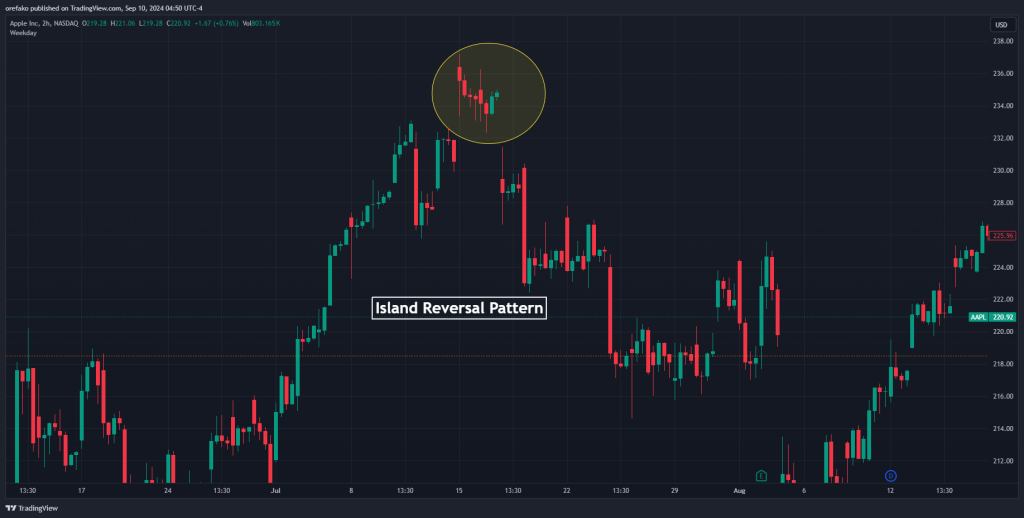
The Island Reversal is a rare but powerful reversal pattern that can be either bullish or bearish, depending on its location within a trend. It consists of a gap in price action that isolates a cluster of trading days (an “island”) from the previous and subsequent price action. For a bearish Island Reversal, the pattern appears at the top of an uptrend, with an upward gap followed by a downward gap, isolating the island at the top. Conversely, a bullish Island Reversal forms at the bottom of a downtrend, with a downward gap followed by an upward gap, isolating the island at the bottom.
This pattern is more common in the stock market chart than in the forex market chart.
14. Cup and Handle Pattern
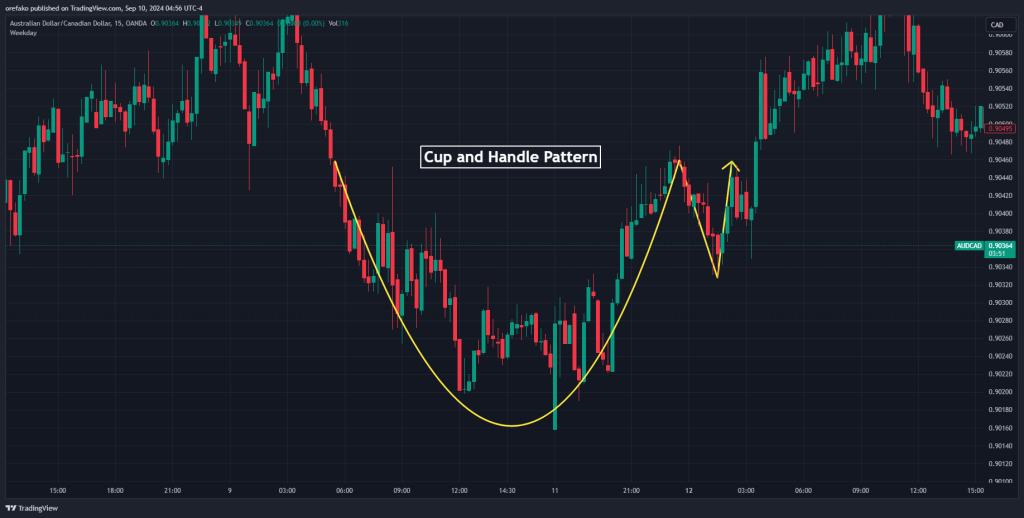
The Cup and Handle pattern is primarily known as a continuation pattern, but it can also act as a reversal pattern, especially when forming at the end of a downtrend. The pattern resembles the shape of a teacup, with a rounded bottom (the cup) followed by a smaller consolidation or pullback (the handle).
- Cup: The cup portion has a rounded bottom that indicates a gradual shift from a bearish to a bullish sentiment. The rounded nature reflects the slow and steady decrease in selling pressure, followed by a gradual increase in buying interest.
- Handle: After the cup forms, a small consolidation or pullback occurs, creating the handle. This handle typically slopes downwards and serves as a pause before continuing the reversal. The handle should not retrace more than a third of the cup’s depth.
The pattern is confirmed when the price breaks above the resistance level formed by the cup’s highs. This breakout suggests a strong potential for a bullish reversal.
Here’s a PDF that contains some of the most common chart patterns you may need in trading:
Common Mistakes to Avoid When Trading Reversal Patterns
Many novice traders make mistakes in trading patterns because they don’t understand that there is more to trading chart patterns than the patterns themselves. There are some nuances and extra confirmations you have to take before the chart patterns begin to work for you.
Here, we’ll talk about some of the most common mistakes to avoid when trading reversal patterns.
1. Entering Too Early Without Confirmation
The first mistake is jumping into a trade before the reversal pattern is fully formed or confirmed. You assume that you can already tell that a pattern is forming, and you jump on it in anticipation of the pattern. Many times, you’ll blow your account this way. Why? Because we trade the charts based on what we see, not what we hope to see.
So, always wait for a pattern to form completely before considering trading it. Also, before entering the trade, always wait for confirmation signals, such as a breakout from key levels or strong volume. This reduces the risk of getting caught in a false signal.
2. Ignoring the Larger Trend Context
Chart patterns mean nothing when they are traded out of context. This is a common mistake among day traders. You don’t just see a chart pattern and jump on it. You have to know what’s going on in higher timeframes to understand the larger trend context. For instance, a bearish pattern will only make more sense to trade if it appears within a larger downtrend or at a significant resistance level.
3. Setting Inappropriate Stop Losses
Even when a chart pattern forms and you’re sure it’s reliable, nothing stops the price from going in the opposite direction to your forecast for a little while before finally going in your direction. But is your stop loss too tight to accommodate that short detour into the opposite direction? Or is it too loose that you almost make no gains even when the trade goes in your direction?
These are questions you must constantly ask yourself as you place your trade.
4. Failing to Adapt to Market Conditions
Using the same approach regardless of changing market conditions can affect the performance of reversal patterns. Sometimes, the market is extremely volatile, and you expect huge moves. Other times, the market looks slow, less volatile, and muted. If you trade a rather muted market the way you trade an extremely volatile market, you’ll see that your profit targets are not getting hit often. And if you trade volatile markets like you’re in muted markets, you’ll find your stop losses getting triggered more often.
That’s why you should always have something with which to gauge the market volatility. The Average True Range indicator is usually the tool for this use. However, you can anticipate high volatility by simply following the news.
5. Neglecting to Use a Trading Plan
Trading without a clear plan, including entry, exit, and risk management rules, often leads to inconsistent decision-making and losses. That’s why we encourage you to develop a comprehensive trading plan that outlines your strategy for trading reversal patterns, including specific criteria for pattern recognition, confirmation, and risk management. If you don’t have a trading journal
Frequently Asked Questions About Reversal Chart Patterns
Let’s see answers to some of the frequently asked questions about reversal chart patterns:
What is the best reversal pattern in forex?
There are common reversal patterns in forex, such as the head and shoulders, and the double tops and bottoms. However, the best reversal chart pattern in forex largely depends on you, the trader.
What timeframe is best for chart patterns?
The best timeframe for chart pattern is the one you’re most comfortable with. Don’t forget that chart patterns are fractal. They appear on all timeframes. However, the best thing you can do for yourself is to include multi-timeframe analysis in your trading of chart patterns.
How do you know if a reversal is coming?
Before trends reverse, they often leave patterns behind to hint that the trend is likely changing. These patterns are called reversal patterns. Common examples are head and shoulders, double tops/bottoms, rising/falling wedge, and the island reversal pattern.
Risk Disclosure: The information provided in this article is not intended to give financial advice, recommend investments, guarantee profits, or shield you from losses. Our content is only for informational purposes and to help you understand the risks and complexity of these markets by providing objective analysis. Before trading, carefully consider your experience, financial goals, and risk tolerance. Trading involves significant potential for financial loss and isn't suitable for everyone.