- Mean reversion in trading assumes that key measures like asset prices and return volatility tend to return to their historical averages over time.
- Tools for technical analysis based on mean reversion include strategies such as utilizing moving averages, applying the Relative Strength Index (RSI), employing Bollinger Bands, and using the stochastic oscillator.
- Mean reversion strategies often have a high success rate since assets tend to return to their historical average price.
In the 19th century, Sir Francis Galton popularized the principle of mean reversion, a groundbreaking discovery in genetics that has since permeated the financial trading industry. The mean reversion concept refers to the tendency of asset prices to always return to their long-term averages. Today, mean reversion trading remains a cornerstone concept among trading strategies in the stock market, forex market, and any other financial market.
This article provides a comprehensive exploration of mean reversion in trading. You’ll gain insights into:
- The definition and significance of mean reversion in trading.
- How mean reversion trading works.
- A comparison of mean reversion and trend-following approaches.
- A real-time example illustrating a mean reversion trading strategy.
- The pros and cons associated with mean reversion Trading.
- What is Mean Reversion in Trading?
- The Mean Reversion Trading Strategy
- Best Indicators for the Reversion to the Mean Trading Strategy
- Mean Reversion VS Trend Following
- How to Use Mean Reversion in Trading?
- Mean Reversion Trading Strategies PDF
- Benefits and Limitations of Mean Reversion Trading
- Is the Mean Reversion a Profitable Trading Strategy?
- Frequently Asked Questions About Mean Reversion
What is Mean Reversion in Trading?
Mean reversion in trading is a concept that refers to the assumption that asset prices and historical returns eventually will return to the long-term mean. This concept is rooted in the statistical phenomenon known as regression toward the mean. Traders who use this strategy typically look for opportunities to buy or sell assets when prices deviate significantly from their historical mean in anticipation of their eventual return to it.
The rationale behind the mean reversion theory is that over time, prices that are unusually high or low will tend to normalize to their average values. This normalization can be due to various factors, including changes in market sentiment, economic factors, or simply the random fluctuations that occur in the financial markets.
For example, if a stock’s price has historically oscillated around $50 but suddenly spikes to $80 without any significant change in the company’s fundamentals, a mean reversion trader might see this as an opportunity to sell the stock, expecting the stock price to fall back to its historical norm. Conversely, if the stock drops to $20, the trader might buy it, anticipating a rise back to the $50 level.
And that’s the basic idea of using mean reversion strategies – looking for extreme changes in prices in an asset price with the assumption that prices tend to return to their average prices.
The Mean Reversion Trading Strategy
Similar to what we’ve mentioned earlier, the mean reversion trading strategy is grounded in the statistical phenomenon that extreme movements in asset prices are likely to be followed by a counter-movement, bringing prices back to their average level over time. So, to effectively employ this strategy, traders must first establish what the ‘mean’ is for their chosen market and time frame.
Now, calculating the mean involves taking an average of the asset’s historical prices over a specific period. This can be done using various tools, such as a simple spreadsheet to calculate the average manually, a mean reversion indicator that automates the process, or by visually inspecting a chart to identify the average price level around which the price has tended to fluctuate.
Once the mean price is established, traders can then watch for significant deviations from this average. Day traders typically look for intraday price movements away from the mean to capitalize on quick reversals. In contrast, swing traders and long-term investors may seek out more pronounced price extremes that occur over days, weeks, or months, anticipating a more significant move back toward the mean.
From the Nikkei Chart below, using the Bollinger Bands indicator, we can see how mean reversion works in trading. We use the upper Bollinger bands to represent the overbought price level, the middle Bollinger Bands to represent the mean, and the lower Bollinger Bands to represent the oversold level.
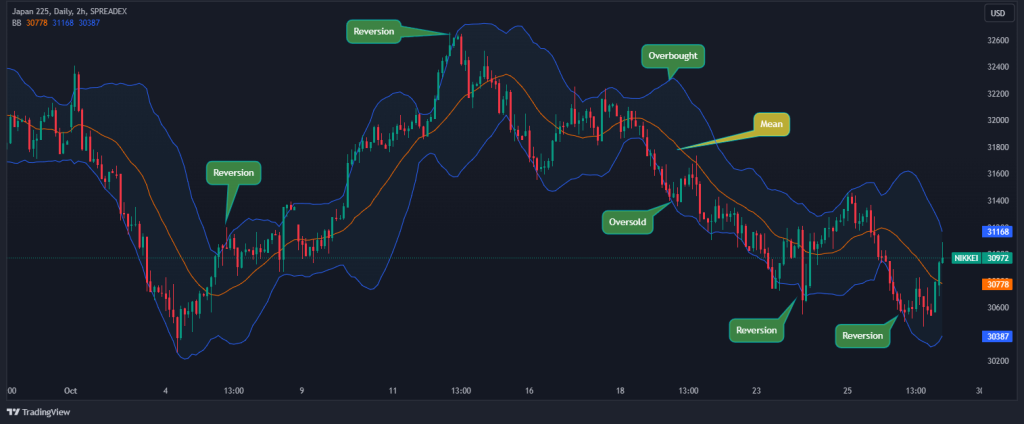
As you can see, most of the time, when the price moves towards the overbought or oversold level, it reverses back to the mean, and as we will see later in this article, these are where our trading opportunities lie.
What are the 6 Best Indicators for Mean Reversion Trading Strategies?
When it comes to the mean reversion trading system, the use of technical indicators is crucial for identifying when prices are deviating from their average and are likely to revert. Here are some of the best indicators used in reversion to the mean trading strategy.
1. Bollinger Bands
Bollinger Bands are among the most popular indicators for mean reversion traders. Created by John Bollinger in the 1980s, these bands consist of a middle band in a simple moving average (SMA) and two outer bands that are standard deviations away from the SMA. The standard setting is a 20-day SMA with the outer bands set at two standard deviations above and below.
The mean reversion strategy of the Bollinger Bands indicator revolves around the three banks of the indicator. Technically, when the price touches or crosses one of the Bollinger Bands, traders may consider it an extreme deviation from the mean, signaling a potential reversal point. The closer the price moves to the outer band, the more overbought or oversold it is considered, hence the higher the chance of reversion.
2. Relative Strength Index (RSI)
The Relative Strength Index is a momentum oscillator that measures the speed and change of price movements. Typically, an RSI reading above 70 indicates that an asset is becoming overbought, while an RSI reading below 30 suggests an oversold condition. Mean reversion traders can use these extreme RSI overbought or oversold conditions to look for reversal opportunities, buying when the market is oversold and selling when it is overbought.
3. Moving Averages
Moving averages are clearly among the best indicators to identify indications for mean reversion. They serve as a smoothed representation of an asset’s typical price over a chosen timeframe and are a foundational tool for identifying mean reversion trends.
Traders watch for deviations from this average: when prices rise significantly above the moving average, reaching into overbought territory, it suggests an expectation that prices will drop back to the mean. Similarly, prices that fall below the moving average to a level considered oversold indicate a potential rebound to the average price.
Also Read: The Best Moving Average for Swing Trading
4. Standard Deviation
Standard deviation is a statistical measurement that sheds light on historical volatility. By measuring how much the price deviates from its mean, this indicator can help traders understand the typical magnitude of price movements.
When the standard deviation of an asset is high, it suggests that the price movement is more volatile and, hence, may revert to the mean more significantly.
5. Moving Average Convergence Divergence (MACD)
The MACD is a trend trading indicator that measures the momentum and direction of an asset. It makes use of two exponential moving average lines constantly crossing one another to give bullish and bearish signals. Mean reversion traders interpret the EMA lines’ growing distance from the midpoint as the instrument deviating from its mean.
6. Mean Reversion Indicator
Some indicators are designed explicitly for mean reversion trading. These include the Mean Reversion Indicator (MRI), which can help traders identify the point at which an asset’s price has deviated significantly from its historical mean price.
This indicator can be handy in stable markets where prices exhibit consistent patterns of fluctuation. However, since this indicator is not built-in on popular platforms like MT4, it requires manually downloading and installing the indicator on MT4/5.
Mean Reversion VS Trend Following (Momentum) Strategies
When exploring different trading strategies, two prominent approaches stand out: mean reversion and trend following. Each strategy is based on a unique understanding of market behavior and offers distinct pathways to profitability.
Mean reversion is predicated on the idea that prices that reach an extreme will revert to their average value while trend following assumes that prices will persist in the direction they have been moving.
The mean reversion strategy is best suited for traders who monitor for significant deviations from historical averages and anticipate a reversal to the norm.
These traders often respond to market overreactions to news or events, which can result in short-term pricing anomalies. For execution, mean reversion strategies typically involve tight stop losses and quick profit-taking to exploit these short-term movements. This approach tends to be more effective in range-bound or sideways-moving markets, appealing to those seeking quick, short-term profits.
In contrast, trend followers look to capitalize on the continuation of existing trends, whether upward or downward, without concern for a stock’s intrinsic value.
They often employ wider stop losses and are prepared to hold positions for more extended periods, benefiting from significant shifts in price. Trend-following strategies are particularly successful in markets with clear bullish or bearish trends, making them suitable for traders with a patient outlook and a longer investment horizon.
If you are still confused, the table below summarizes the key aspects of these two trading strategies:
| Aspect | Mean Reversion | Trend Following (Momentum) |
| Core Theory | Prices revert to the mean after extremes | Prices continue to move in the current trend |
| Strategy | Capitalize on temporary price extremes | Ride out long-term trends |
| Market Reaction | Overreaction to news/events | Persistence of price movements |
| Price Valuation | Looks for deviation from the historical average | Focus on trend continuation, not value |
| Trade Execution | Tight stop losses, quick profit-taking | Wider stop losses, longer position hold |
| Risk Management | Capture short-term movements | Benefit from significant price shifts |
| Performance | Works well in range-bound markets | Excels in markets with sustained trends |
| Suitability | Short-term, quick profit seekers | Patient traders, long-term investment |
| Market Outlook | Sideways, oscillating markets | Bullish or bearish sustained markets |
In sum, the distinction between mean reversion and trend following is not merely theoretical; it has practical implications for trade execution, risk management, and portfolio construction. Ultimately, the choice between the two strategies may hinge more on a trader’s personal risk tolerance, investment horizon, and market perspective than on the inherent superiority of one strategy over the other.
How to Use Mean Reversion in Trading?
Now, let’s take a look at an example of how to trade financial assets using the mean reversion strategy. For this mean reversion trade example, we will use the intraday mean reversion strategy.
The difference between the intraday mean reversion strategy and longer-term strategies is seen in the period of the moving averages used and the selected timeframe. So, if intraday trading isn’t your thing, feel free to tweak the settings to suit your trading style. Nonetheless, the technique works pretty much the same for any chosen timeframe.
With that said, we will be using the 50 EMA and the RSI on the hourly time frame in this example.
Here’s a breakdown of how to use this strategy:
- Firstly, we use the moving average to determine the mean value of the asset. When the price is above the moving average, we expect the price to reverse to the moving average line and vice versa.
- After this, we use the RSI as a confluence trading tool to indicate where the price is truly overbought or oversold. In that case, if the price is above the 50 exponential moving average and at the same time it is overbought on the RSI, we can quickly enter a sell position and set our profit target at the moving average.
Let’s see what this looks like on a chart:
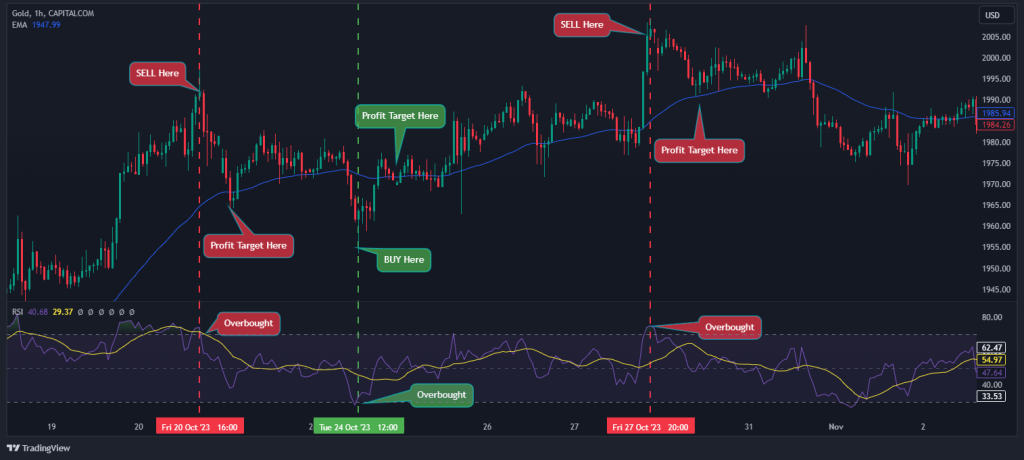
As you can see from the chart above, based on the mean reversion trading strategy, we assume that the price will reverse back to its mean reversion; hence, the price returns to trade closely to the moving average indicator’s line.
About risk management – With these trade opportunities, we always aim to set our profit targets at the moving average. Also, we can always place our stop loss slightly above the high when we are selling and below the low when entering a long position.
Mean Reversion Trading Strategies PDF
Here you can download our free Mean Reversion trading strategy PDF:
Mean Reversion Trading Strategies
Benefits and Limitations of the Mean Reversion Trading
Mean reversion trading is a strategy that can be both rewarding and challenging, offering unique advantages and potential drawbacks. Let’s quickly see some of the pros and cons of this strategy.
Benefits
- Mean reversion strategies often have a high win rate because they capitalize on the natural flow of price movements around a historical average.
- This strategy provides clear criteria for entry and exit points, which can simplify trade decisions and risk management.
- Mean reversion is particularly effective in markets that are not trending strongly in either direction but are instead moving within a range.
- Mean reversion trades are typically short-term, which can result in quick intraday profits and the ability to compound gains over time.
- The rules-based nature of mean reversion trading makes it well-suited for automation, allowing for backtesting and systematic execution of trades.
Limitations
- This strategy can be counterintuitive as it involves buying during a falling market and selling in a rising market, which can be psychologically challenging for traders.
- Mean reversion strategies may underperform in trending markets where prices continue to move away from the mean for extended periods.
- Unexpected market events can lead to significant price moves that do not quickly revert to the mean, resulting in large drawdowns.
- To be effective, mean reversion trading often requires constant monitoring and adjustment of positions, which can be time-consuming.
Is the Mean Reversion a Profitable Trading Strategy?
From the backtesting results, if done correctly, you can expect to have win rates between 66% and 80%. This level of success rate shows the potential profitability of mean reversion trading, especially when executed with discipline and proper risk management.
However, while it offers a lesser risk-reward ratio compared to trend trading, that shouldn’t be a deal breaker, especially if you’re a day trader. It simply means that you won’t have to worry about the effect of overnight market movements on your position.
Nonetheless, to answer the question simply: is the mean reversion a profitable trading strategy? Yes! However, as with any trading approach, a well-considered trading plan is critical to reaping the benefits that reversion has to offer.
Bottom Line
In the financial markets, asset prices tend to trade at their average value. When trading at this mean value, they’re neither undervalued nor overvalued. But there are times when market volatility or market conditions tip this value price balance. This is where Mean Reversion traders step in to scout reversion opportunities with their strategies to trade the asset back into its mean value.
However, there are two ways for an asset’s price to trade at the mean. Either the price returns to the price level, or the mean level goes to meet the price. So, when you’re trading any mean trading strategy, remember this inherent risk with the strategy and manage your risk accordingly.
Frequently Asked Questions About Mean Reversion
Here are some of the frequently asked questions on mean reversion trading strategy:
What is the best timeframe for mean reversion?
The best timeframe for mean reversion trading varies depending on the market and the specific asset. However, it is commonly applied to shorter timeframes such as daily or hourly charts. This is because mean reversion seeks to exploit short-term fluctuations in price, and these periods are long enough to establish a reliable mean but short enough to allow for frequent trading opportunities. Furthermore, when using the mean reversion strategy, it is advisable to utilize multiple timeframe analyses.
Do hedge funds use mean reversion?
Hedge funds use mean reversions. In fact, they are some of the biggest users of mean reversion trading strategies. Usually, they do this with two correlated assets or instruments, such as the EURUSD and the GBPUSD. When hedge fund managers notice a divergence in the movement of these two instruments, they may buy the undervalued one and sell the overvalued one.
Risk Disclosure: The information provided in this article is not intended to give financial advice, recommend investments, guarantee profits, or shield you from losses. Our content is only for informational purposes and to help you understand the risks and complexity of these markets by providing objective analysis. Before trading, carefully consider your experience, financial goals, and risk tolerance. Trading involves significant potential for financial loss and isn't suitable for everyone.