- Scalping is a trading style involving the use of small timeframes to catch little changes in price movements in the financial markets.
- Because scalping is extremely fast-paced, many scalpers rely on indicators to help them take the guesswork out of their trading.
- The MACD, EMA, Schaff Trend Cycle, RSI, Parabolic SAR, VWAP, and Bollinger Bands are some of the best scalping indicators.
- To complement their indicators, some of the strategies scalpers mostly rely on are the 9 EMA, three MA crossover, range trading, volume trading, and the breakout strategy.
Scalping is similar to F1 racing. Things are going so fast that you barely have the time to react. There are a lot of decisions to make but very little time to make them. Any little moment of distraction could cost you the race.
However, with indicators, scalpers can have better control over their trades than F1 racers can over their races. Indicators allow scalpers to make quick decisions following the potential price trends. And if you’re a scalper or want to be one, this piece describes the 7 best scalping indicators.
What is Scalping?
Scalping is a form of trading that involves using small timeframes to catch small price movements to profit from them. Scalpers are traders who practice this kind of trading.
The idea behind scalping is quite simple: It’s easier to catch smaller moves than it is to catch bigger moves. For instance, the price is more likely to move by 5 pips than it is to move by 100 pips. Even if it does move by 100 pips, it may take a long time to do so. But in this time, the scalper has had the opportunity to take as many as 20 5-pip trades.
Of course, that is an oversimplification of how scalping works, but it serves our purpose of showing you the principle behind scalping.
Scalpers often get in and out of trades within seconds or minutes. They aren’t looking to be in trades for over an hour most times. Because they only want to accumulate many small wins from small price changes. They can take multiple trades on a trading day. Sometimes more than a hundred. And as for scalpers who automate their trades, they can take more trades within a trading day.
And that is why scalpers prefer forex brokers with very low spreads. Because in scalp trading, every single point counts.
In terms of trading analysis tools, the 1-minute, 5-minute, and 15-minute timeframes are best for scalping because they show how the price has moved in a short period of time. However, scalpers also use the multi-timeframe analysis, with one higher timeframe that helps to absorb the primary market trend.
Top 7 Scalping Indicators to Use
Having shown you why scalpers and indicators are close buddies, here are the top 7 scalping indicators out there.
1. Relative Strength Index (RSI) Indicator
The Relative Strength Index (RSI) indicator is one of the most popular indicators across the board. And for scalpers who rely on indicators, it’s an indispensable tool. This scalping indicator measures how fast the price of an asset is changing. It uses this data to determine whether there’s too much buying pressure (overbought) or selling pressure (oversold) on the asset.
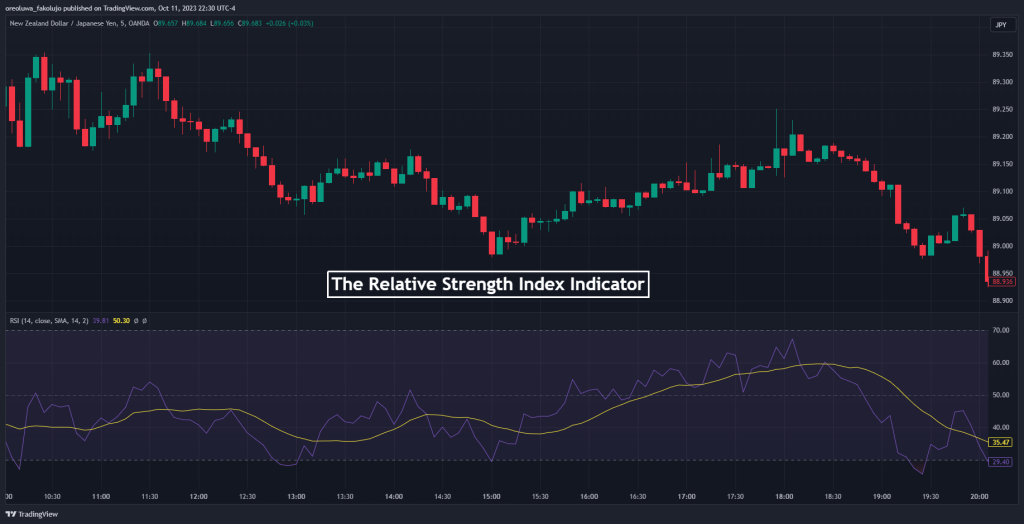
The RSI indicator, by default, oscillates between levels 0 and 100. But when it crosses above the 70 mark, the asset is considered overbought. But it is oversold if it crosses below the 30 mark.
The strength of the RSI is that there are many ways to use it. With this indicator, you can identify overbought and oversold levels, catch trends using the crossovers, and even catch divergences.
How to Use the RSI Indicator?
Many scalpers rely on the RSI for reversal trading through overbought and oversold conditions. A price reversal to the downside is likely whenever the indicator rises into the overbought territory (beyond 70). And when the indicator sinks into the oversold region (below 30), a price reversal to the upside is likely.
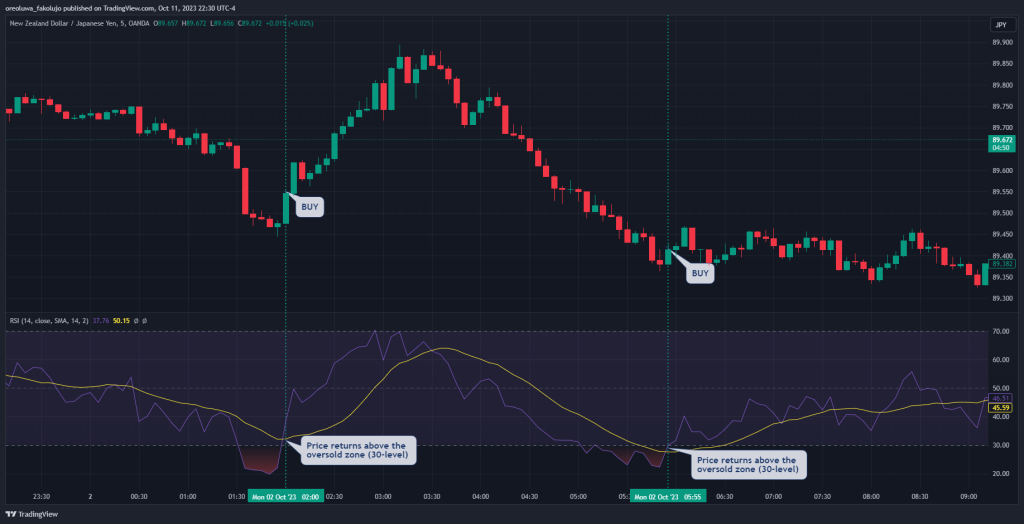
For trade entries, go short when the indicator dips below the 70 level after first breaking out of it. That way, you catch the price just as it reverses out of the overbought zone. And for long trades, wait for the price to rise above the oversold level after dipping below it. (below the 30 mark).
2. Exponential Moving Average (EMA) Indicator
The Exponential Moving Average (EMA) indicator is another reliable indicator of scalpers. Why? Because it’s just a simple line on the chart. It helps to determine the overall trend of the market while placing some emphasis on recent price data.
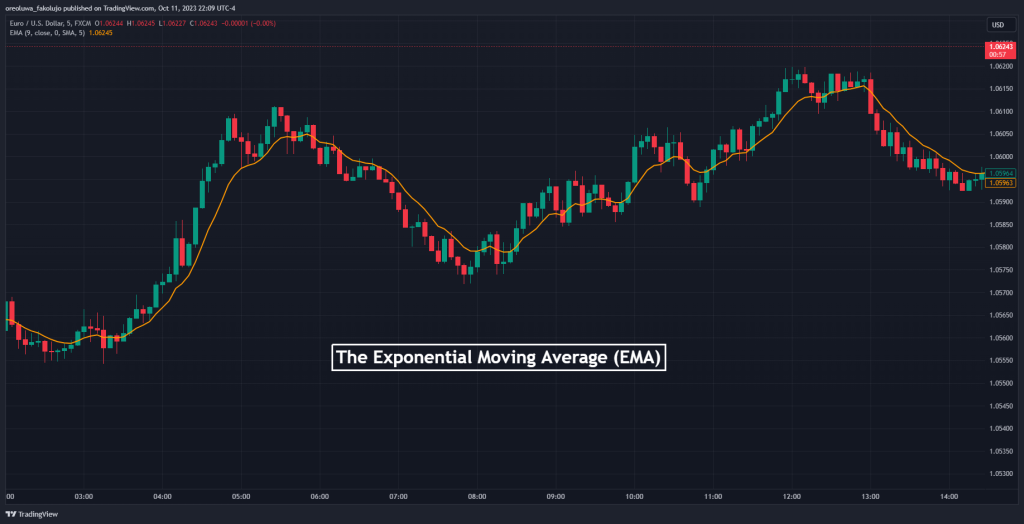
Despite being just a line, you can use it in various ways. Combine multiple EMAs, and you will have a strong strategy in your hands. If you would rather use it with other technical indicators, the EMA allows for that. If you need something objective with which you can tell trends, the EMA is also perfect for this.
The EMA’s ability to be useful in just about any market condition and strategy makes it an indispensable weapon in the armory of scalpers.
How to Use the EMA Indicator?
An easy way to use the EMA is by combining two or more periods together. For example, you could use the 9 and 15 EMAs. The rules are simple:
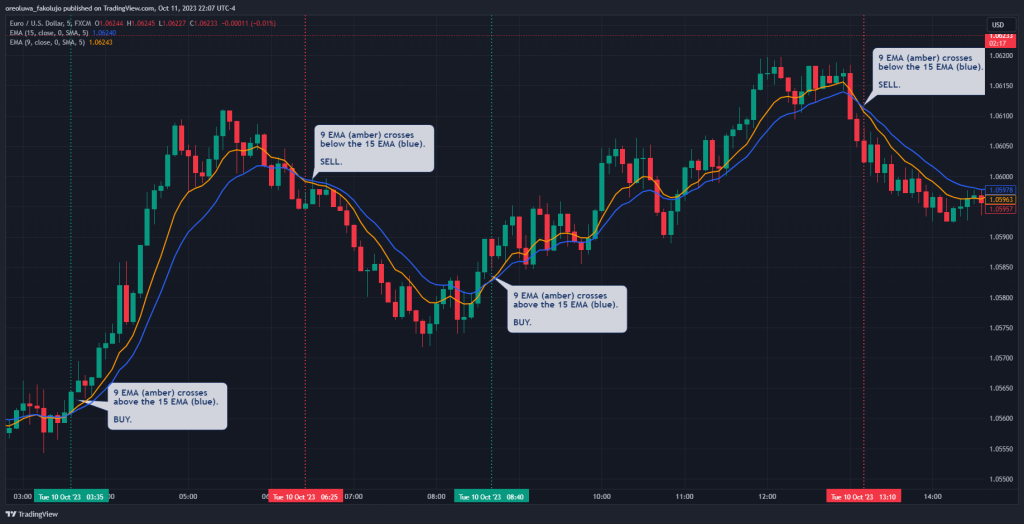
- Buy when the 9EMA crosses the 15 EMA to the upside.
- Sell when the 9 EMA crosses the 15 EMA to the downside.
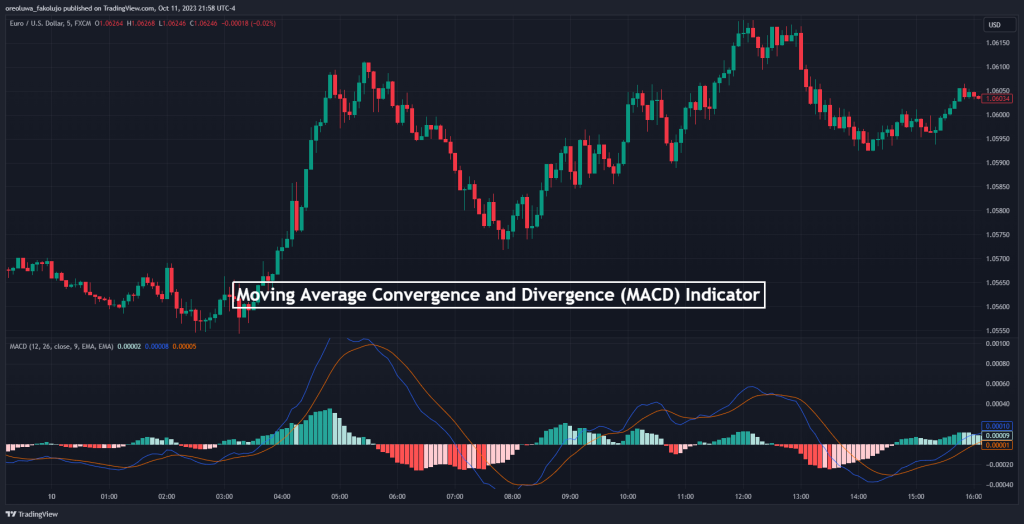
3. Moving Average Convergence Divergence (MACD) Indicator
The Moving Average Convergence Divergence (MACD) indicator is third on this list, but it’s by no means inferior to the others ahead of it. This scalp trading tool is a momentum indicator that relies heavily on EMAs for its calculation, which is why it is a good trend trading indicator.
How to Use the MACD Indicator?
Crossovers are one of the simplest ways to use the MACD. Whenever you have two or more histogram bars forming on the positive side of the indicator, that’s your bullish signal. And once you have a minimum of two histogram bars forming on the negative side, that’s your bearish entry.
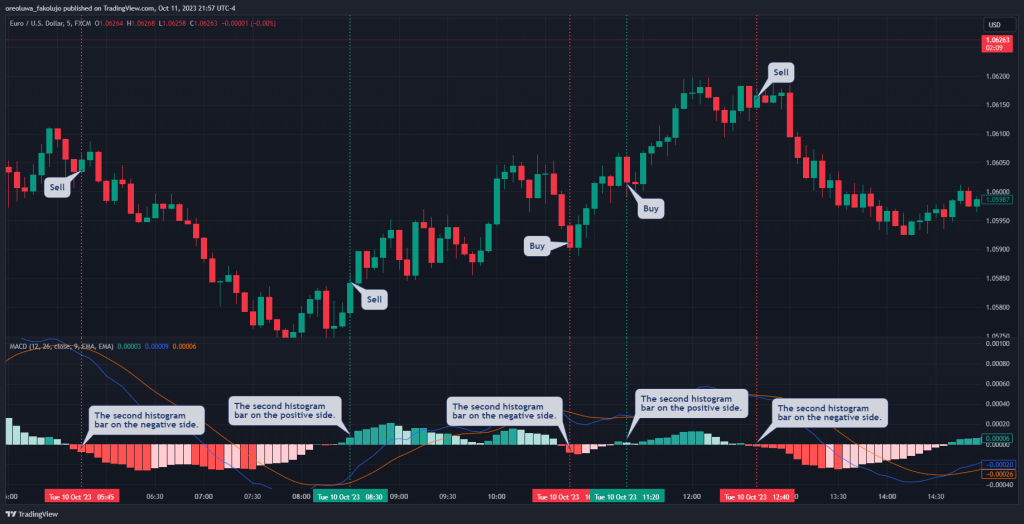
Note that you don’t have to wait for the two histogram bars to form before your entry. Some aggressive traders take their entries on the first bar that forms. However, the second bar only serves as a confirmation of the trend.
4. Bollinger Bands Indicator
Bollinger Bands are also great for scalpers. The indicator shows the direction of trends using three bands. The upper and lower bands are the standard deviation, while the middle band is a moving average. You may have a ranging market When the bands move more sideways than upward or downward. Also, if the bands constrict, there’s low volume in the market. This may be a sign of a dead market.
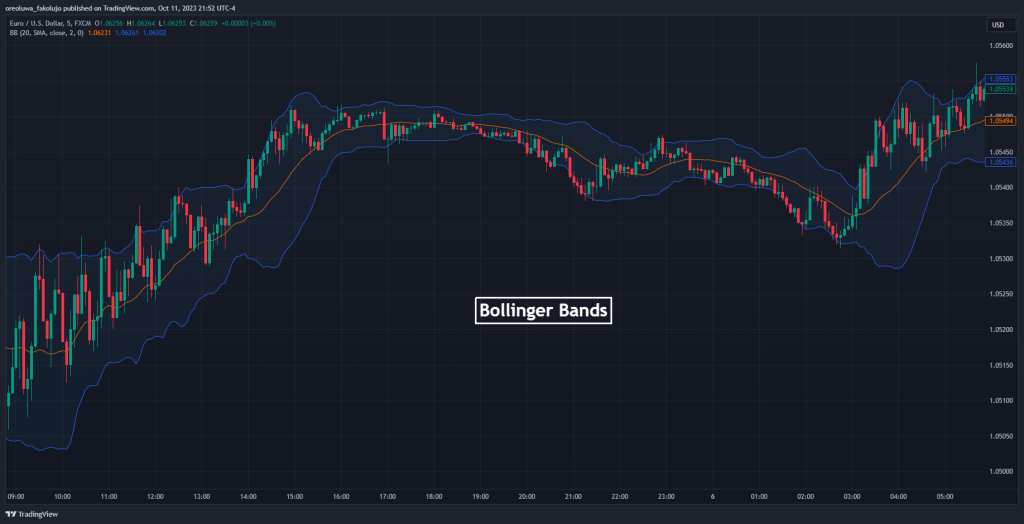
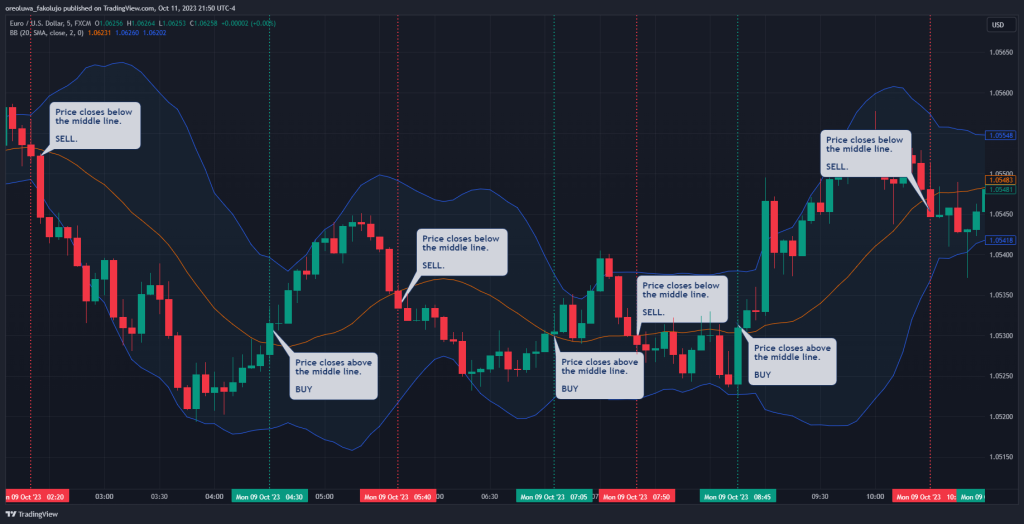
How to Use the Bollinger Bands Indicator?
A signal is generated whenever the price crosses the Bollinger Bands midpoint. For an upward crossover of the midpoint, you have a bullish signal. And for a downward crossover, you have a bearish signal.
5. Volume-Weighted Average Price (VWAP) Indicator
The Volume Weighted Average Price indicator is one of the best indicators for short-term traders of all forms. In fact, it’s not useful on any of the larger timeframes, as it would only stick too close to the price for any reasonable deductions on timeframes higher than the 1hr. On lower timeframes, however, it’s a very formidable tool.
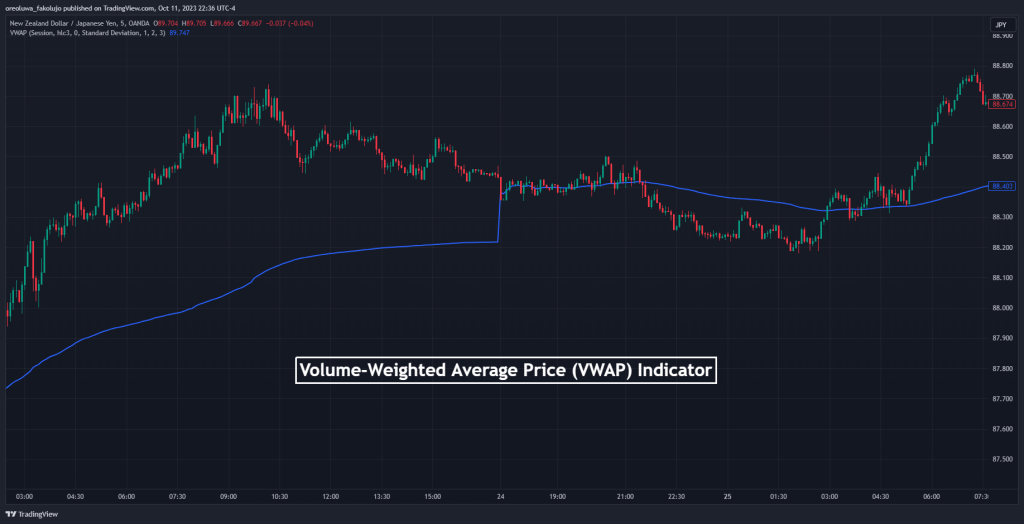
The powerful thing the VWAP has going for it is that you can easily spot ranging markets with it. It’s most likely a ranging market whenever the price consistently hangs too close to the VWAP line. And if you’re a trend trader, that’s your cue to take a break from the market.
How to Use the VWAP Indicator?
The VWAP is likely not the indicator you want to take entries off. Rather, you want to confirm your trends with it. If the price is above the VWAP line, the market is bullish. But if the price is below the VWAP line, the price is bearish.
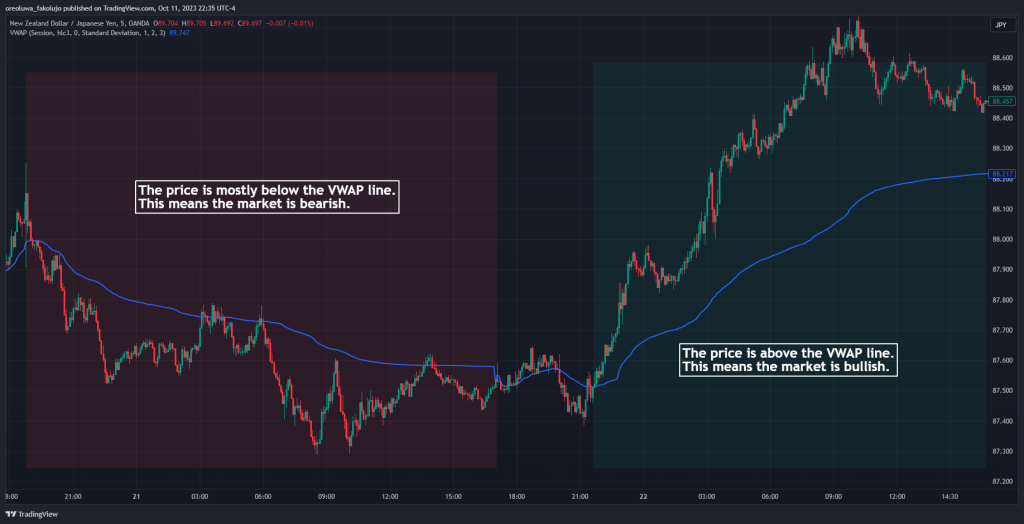
After confirming your trend with the VWAP, you can use another indicator or technical analysis tool to seek out your buy and sell signals.
6. Parabolic SAR
The Parabolic SAR indicator uses a series of dots below and above the price to tell if the market is in an uptrend or downtrend.
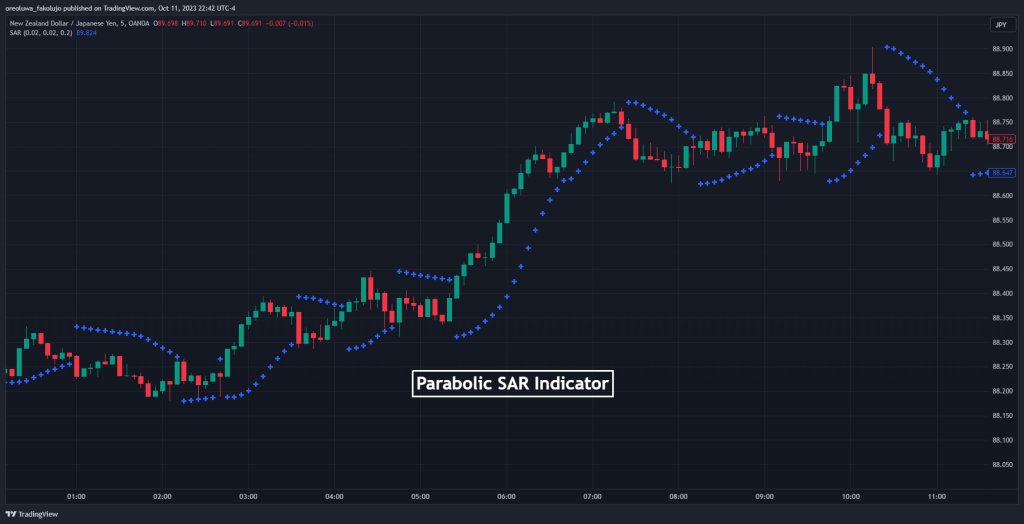
One of the strengths of the Parabolic SAR is in determining steady trends. Whenever the dots appear underneath the price, there’s good reason to believe the price is not uptrend. And whenever the dots form above the price, you can expect downward movements.
Many scalpers have come to rely on this simple trend-determination method over time.
How to Use the Parabolic SAR Indicator?
Entering positions with the Parabolic SAR is simple. Take a bullish trade after the formation of the first dot underneath the price. Conversely, take bearish trades after the formation of the first dot above the price.
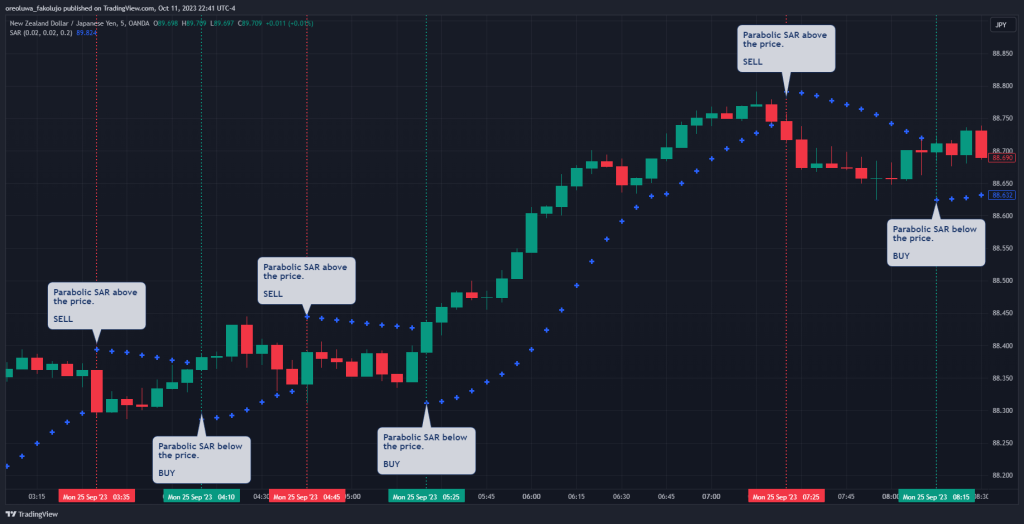
You can also use the Parabolic SAR to confirm your trends instead of taking trades with it.
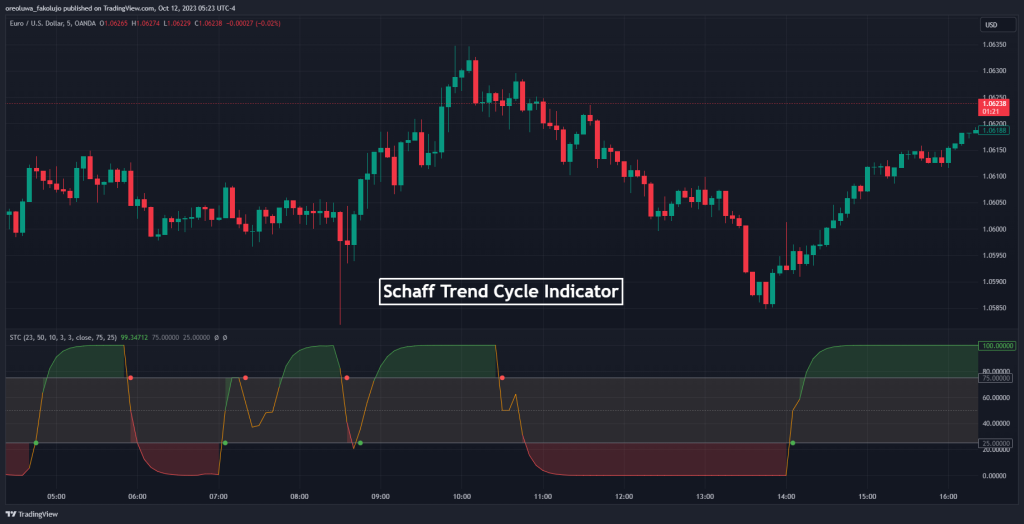
7. Schaff Trend Cycle (STC) Indicator
When you mix the MACD and the Stochastic indicators, you get the Schaff Trend Cycle indicator. And its advantage over its “parent indicators” is that it reacts more quickly to price changes. So, aggressive scalpers who think the MACD is too slow for their liking would feel right at home using the STC.
How to Use the STC Indicator?
By default, the STC indicator oscillates between 0 and 100. Whenever the price rises above the 75 level and dips back below it, you have your bearish signal. And whenever the price falls below the 25 level and rises back above it, you have your bullish signal.
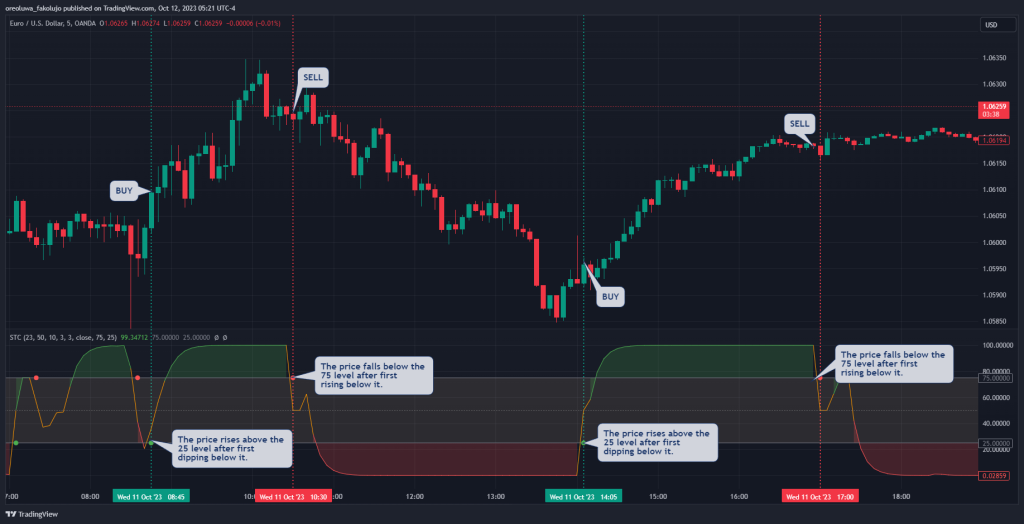
However, this strategy can be too aggressive, even for some scalpers, so combining the STC with other indicators is best.
5 Popular Scalping Strategies
The best indicators are useless without being a part of a trading strategy. Scalpers know this, and these are five popular scalp trading strategies they use:
1. 9 EMA Strategy
There’s something uncanny about the 9-period Exponential Moving Average, especially in the hands of a scalper. It is so uncanny that many strategies are based on this specific indicator and period alone. And the reason it’s perfect for scalpers is that it sticks close enough to the price action to be sensitive to signals and price changes. At the same time, it stays just far enough away not to get too noisy.
2. 3 Moving Average Crossover
This is, perhaps, one of the most relied-on strategies by beginner and professional traders alike. The best thing about moving averages is that they’re very easy to use, and their signals are very easy to spot. And when you combine three moving averages, they tell a story that scalpers can use to predict short-term price movements.
3. Range Trading Strategy
The concept that the price moves in an uptrend, downtrend, or range is what drives this strategy. It’s based on the simple laws of support and resistance and is relatively easy to use. The reason many scalpers have fallen in love with it is that ranges are very common on smaller timeframes. As such, this strategy offers many potential trading opportunities.
4. The Breakout Strategy
What happens when the price breaks out of range? This trading strategy caters to that. It shows scalp traders just what to do when the price breaks out of range.
5. Volume Strategy
Another popular trading strategy among scalpers is the volume strategy, which involves the study of volume indicators to make market direction predictions. This strategy is probably not as common as the other four, but it’s still popular enough to earn a spot on this list.
Why Do Scalpers Use Indicators?
Many scalpers prefer to use indicators because these tools perfectly cover one of the major weaknesses of scalping: too fast-paced.
How so?
Scalping is fast-paced. Candles on a price chart are being formed every minute on the 1-minute time frame, for instance. That means the scalper only has a minute to analyze the current market condition, decide whether to buy or sell, and enter their trades. And because of the nature of scalping, they get to do this many times during a trading day as long as their trade setup shows up. This can be a lot to keep up with for many scalpers.
Indicators, though, are a perfect solution to this. Many indicators are objective, and they’re not subject to the opinions or interpretations of traders. As a result, it takes some emotional burden and decision-making time off the shoulders of scalpers. In fact, this is why many scalpers build meta-trader expert advisors that automate trade entries based on indicators. They don’t have to be there to make subjective judgments. They can instead program the code to do objective/logical work for them.
Over To You
There you have it: the best scalping indicators. But before you go, remember that no indicator is not the holy grail. It won’t give you a 100% win rate. It might not even give you 50%. So why do we consider them as the best? Because when you combine them with one another and with other indicators, you’ll begin to come up with some really impressive results.
Long story short, don’t rely on any of them in isolation. Use them in confluence with other indicators and trading tools. Also, you don’t have to use these indicators at their default values. Depending on your trading style, you can tweak them until you get the best results.
Finally, our best scalping indicators may not be your best scalping indicators. But don’t worry. We have something for you in the indicators archive of our website. There, we go into details about many indicators and how to trade using them.
Frequently Asked Questions About Scalping Indicators
Find answers to some of the most frequently asked questions about scalping indicators here:
What is the best indicator for 5-minute scalping?
The RSI, MACD, Parabolic SAR, and EMA are great for 5-minute scalping. The VWAP and Schaff trend cycle and Bollinger Bands are also useful. However, the best indicator for 5-minute scalping or any timeframe scalping depends on you, your trading style, and your strategy. After all, a tool is only as useful as its user.
Which chart type is best for scalping?
The 15-minute, 5-minute, and 1-minute charts are best for scalping. They capture the small price changes very perfectly. However, it is common for scalpers to go to the 1-hour time frame to see the bigger picture of the market.
Is a 1 min chart good for scalping?
Generally, the 1-minute chart is good for scalping. But whether it is good for you would depend on your trading strategy. Most traders who use the 1-minute chart rely on higher timeframes to get a clearer picture of what the price is trying to do. Without this multi-timeframe analysis, the 1-minute chart may tend to be noisy and devoid of any reasonable direction.
Is scalping harder than day trading?
Scalping is not harder than day trading. Neither is day trading harder than scalping. Both have their advantages and disadvantages. For instance, scalping requires complete focus and the ability to think quickly because things are moving very quickly on their timeframes. Day trading is a little forgiving in this aspect. However, day trading generally involves more pips in play, which can mean bigger risks for some traders.
Risk Disclosure: The information provided in this article is not intended to give financial advice, recommend investments, guarantee profits, or shield you from losses. Our content is only for informational purposes and to help you understand the risks and complexity of these markets by providing objective analysis. Before trading, carefully consider your experience, financial goals, and risk tolerance. Trading involves significant potential for financial loss and isn't suitable for everyone.