- Introduced by J. Peter Steidlmayer, market profile trading combines price and time information in a statistical distribution, often resembling a bell curve, offering a unique visual representation of market dynamics..
- Market profiles are essential for traders as they merge time, price, and volume data to provide a detailed view of market activity.
- For beginners, understanding the Time Price Opportunity (TPO) chart, the Market Profile Value Area, and concepts like the Point of Control, Bell Curve, and Initial Balance is crucial for gaining insights into market dynamics and making informed trading decisions.
Market profile trading is a unique trading technique often used by institutional and retail traders. With the market profile tool, traders get an insight into the relationship between time and price, providing them a behind-the-scenes insight into what’s happening in the market.
This article will cover everything you need to get started with market profile trading, including how to read and use market profile charts.
- What is a Market Profile Trading?
- Why Are Market Profiles Important to Traders?
- How to Read Market Profile Charts
- How to Use the Market Profile Analysis in Trading
- The Free Market Profile Trading Strategy PDF
- What are the Advantages and Disadvantages of Market Profile Trading?
- Market Profile Trading Summed Up
- Frequently Asked Questions About Market Profile Trading
What is a Market Profile Trading?
Market profile was introduced in 1985 by J. Peter Steidlmayer, a trader at the Chicago Board of Trade (CBOT), as a part of a CBOT product. It provided a visual representation combining price and time information in a statistical distribution, often resembling a bell curve.
Here’s what the market profile looks like on a price chart:
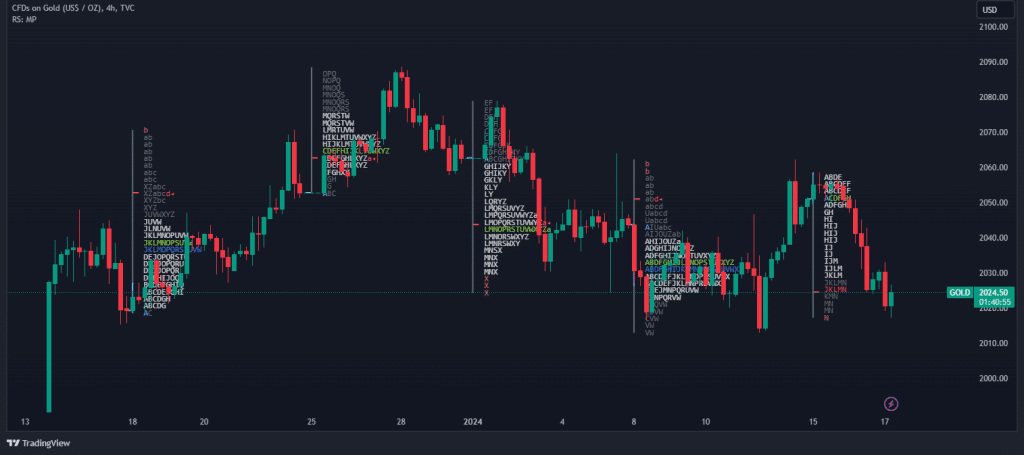
As you can see, unlike traditional charting methods that primarily focus on price movements, market profiles incorporate the time element into the analysis. This approach evaluates at what times a security traded at specific prices, disregarding factors like trading volume. This method of analysis is depicted through a charting tool that organizes data by displaying letters, each representing a specific time frame during the trading day.
Each letter in the alphabet represents a specific time period for which the market traded at a particular price. These are known as Time Price Opportunities (TPOs). For example, the first 30-minute period of the trading session might be represented by the letter ‘A’, the next 30 minutes by ‘B’, and so on. The letters continue sequentially with each time period throughout the trading session.
As the trading day progresses, each price level at which trading occurs is recorded using the corresponding letter for that time period. This forms a visual representation of the market’s trading activity. If the price returns to a level it traded at earlier in the day, the new letter is added next to the previous ones at that price level. Over time, this method builds a bell-shaped, or normal, distribution curve of prices showing where most trading activity took place. The areas with the most letters show price levels with the highest trading activity, indicating key support and resistance levels.
Ultimately, market profile trading is extremely useful for understanding the flow of the market by visualizing the price points where the market spent the most time. These areas, often identified as high-importance price points, are interpreted as potential support and resistance levels in market analysis.
Why Are Market Profiles Important to Traders?
Market profiles offer traders a comprehensive perspective on market dynamics through the integration of time, price, and volume data. This enhanced view provides a deeper understanding of market structure by showing the intensity of trading activity at different price levels. Ultimately, it’s an excellent tool for identifying key levels in trading.
Key elements like the Point of Control (POC) and Value Area are crucial in market profiles. For instance, the POC highlights the level with the most trading activity, serving as a focal point for future prices, while the Value Area, accounting for about 70% of trading activity, indicates where the majority of trades occurred. These features are vital for identifying critical support and resistance levels and understanding market sentiment. In trading, there’s a tendency for prices to revert back to the area where most trading activity has occurred during a certain period.
Additionally, the shape and location of the market profile chart, particularly the POC and Value Area, provide insights into market sentiment, allowing traders to adjust their strategies accordingly. Market profiles also assist in creating strategic trade setups by recognizing patterns and differentiating between consolidation and breakout periods.
Taking all the above into account, so yes, market profile analysis is a great tool for analyzing the markets. It’s a huge part of the Smart Money Concept and Order Flow trading since it provides an indication of where financial institutions and market makers are about to place their orders.
How to Read Market Profile Charts
Like many other trading strategies, the most important part of market profile trading is to learn how to read market profile charts. These types of charts can be a game-changer for beginners in trading, offering unique insights into market dynamics.
Here are some techniques to help you get started with market profile trading.
1. Understanding Time Price Opportunity (TPO)
The TPO chart is a fundamental element of market profiles. It represents the price points where the market has traded during specific time intervals, usually in 30-minute periods. Each TPO in every area indicates a time when the market touched a particular price. This way, you get a detailed view of how long and at what price levels the market values an asset, and it allows you to know the high, low, and the area where the majority of trading activity has occurred.

2. Interpreting the Market Profile Value Area
The value area in a market profile represents a range where about 70% of the trades occurred during a session. This area is crucial because it indicates where buyers and sellers mostly agree on prices. The Value Area helps you understand the market consensus and potential support or resistance levels.

3. Point of Control (POC)
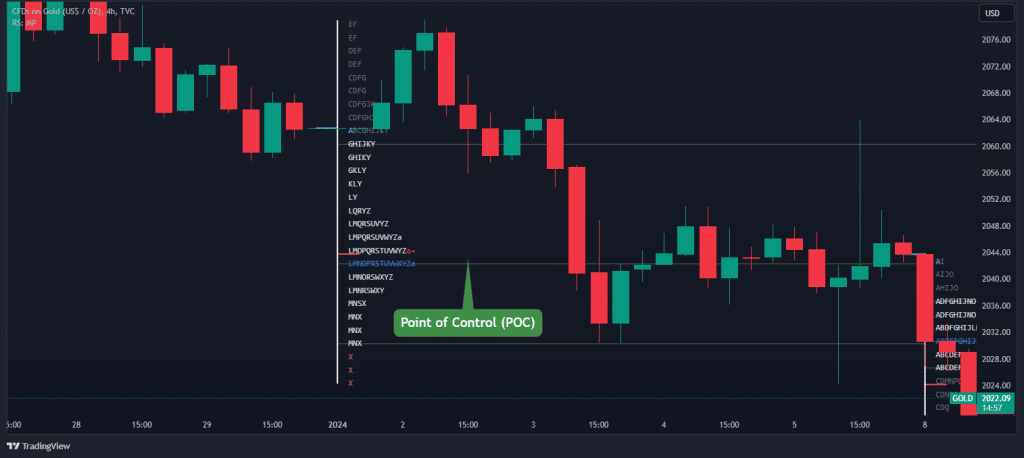
The POC is the price level with the most trading activity within the value area. It functions as a magnet for future prices and is considered a key reference point. The POC is typically where the market sees the ‘fairest’ price for the trading session, and it can be identified as the column with the most letters.
4. Initial Balance (IB)
The initial balance is defined by the range of the first two TPO periods after the market opens. This range can provide early signals about the market’s direction for the day and is often used as part of the Open Range Breakout trading strategy. A wide initial balance might indicate a range-bound day, while a narrow initial balance often points to a trending day.

How to Use the Market Profile Analysis in Trading
When dealing with market profile analysis, it’s important to visualize that the chart is built around the concept of ‘value’. In any given trading session, there are prices that the market decides are ‘fair’, and much of the trading activity will occur around these levels. These form the ‘Value Area’ – the range of prices where a significant portion of trading volume has taken place.

Most of the time, the trading activity forms a bell-shaped curve, just like the one shown in the above chart. This is the market telling you where it’s comfortable. The peak of the curve is where the most trading has occurred, known as the Point of Control (POC). This is where the market has spent a lot of time and where the most volume has been traded – it’s essentially the market’s favorite price of the session.
So, why does this matter? As a trader, you want to know where the market ‘lives’. If you see prices moving away from the Value Area, you’re witnessing the market stretching its legs. But here’s the catch – it often comes back to its comfort zone. This is where market profile analysis becomes your compass.
When you see prices venturing too far from the POC or the Value Area, you can start to look for signs of the market returning to balance. This could be your opportunity to ride the wave back to the center.
Let’s not get into the nitty-gritty of buy and sell signals – there’s no one-size-fits-all strategy here. But what I can share with you is this: pay attention to how the market behaves around the Value Area.
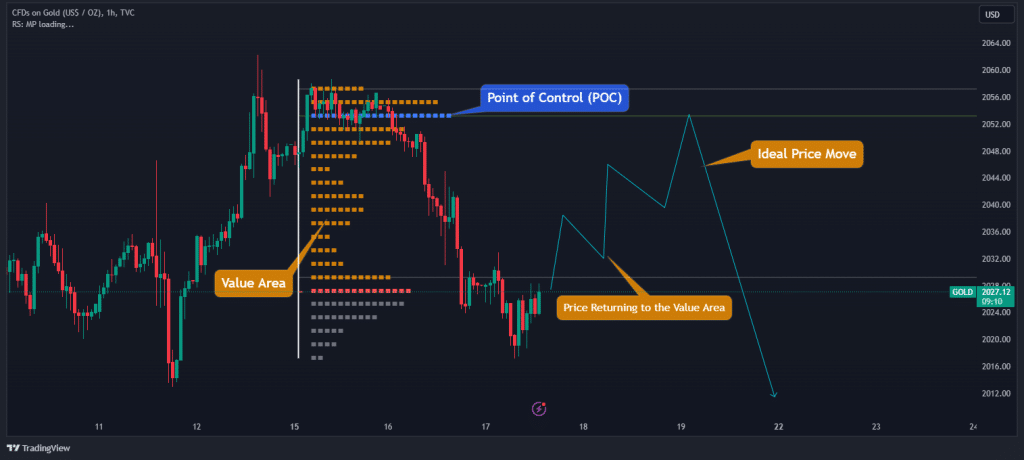
For example, looking at this Gold chart above, the price is hovering just outside the value area and it started showing signs of returning. This movement could signal an entry point for a short-sell trade, aiming for the price to move back into the thick of trading activity. Conversely, if the price blasts through the Value Area with heavy volume, it might be a reversal, and you might want to adjust your sails to follow the new trend.
The Free Market Profile Trading Strategy PDF
If you need something to easily carry around and refer to when it comes to market profile trading strategy, this PDF is for you:
The Free Market Profile Trading Strategy PDF
What are the Benefits and Limitations of Market Profile Trading?
Market Profile trading offers a range of advantages and disadvantages that are crucial for traders and analysts to understand:
Benefits of Market Profile Trading
The main benefit of using the market profile is that it provides an in-depth view of market dynamics by combining price, time, and volume data. This allows for a more comprehensive understanding of market sentiment and trends. It, therefore, helps in identifying significant levels like the Point of Control (POC), Value Area High (VAH), and Value Area Low (VAL). These levels are essential for understanding where the market sees value and where the price might move next.
Pros
- Market Profile can be used to support trading decisions by offering insights into market sentiment and potential price movements.
- It aids in identifying different types of market days such as trend days, normal days, and double-distribution days.
- The Market Profile analysis assists in identifying key levels where large institutions place orders, making it an ideal tool for SMC.
Limitations of Market Profile Trading
The methodology of market profile can be complex and may require a steep learning curve, especially for new traders. As with any analytical tool, there’s a risk of misinterpreting the data, which can lead to incorrect trading decisions.
Additionally, the use of market profile trading depends on the indicator you find, which is not a built-in indicator like RSI, MACD, or Bollinger bands. As such, regardless of the trading platform you use, you must find a reliable third-party indicator to get the best trading signals.
Cons
- Finding a reliable Market Profile indicator can be a daunting task.
- Incorrect or biased interpretations can lead to flawed conclusions and trading strategies.
- Relying solely on Market Profile can limit the scope of analysis and may overlook other critical market factors.
Market Profile Analysis Summed Up
So, as we conclude this article, one of the most common concerns is knowing if this style of trading works for trading. The short answer is: Yes, it does. A market profile tool is a simple way to analyze the market. The theory behind it is that prices tend to revert to areas where most of the trading activity has occurred. Therefore, it helps traders identify market trends, key price levels, and potential turning points in the market.
If you wish to learn more about market profile trading and value area trading strategy, you can join our trading academy, where our trading coaches provide you with all the necessary information and tools to make your first steps in the trading arena.
Frequently Asked Questions About Market Profile Trading
Here are some frequently asked questions about market profile trading.
Can market profile analysis predict market trends?
While Market Profile Analysis doesn’t directly predict market trends, it aids in identifying them. By analyzing the distribution of trading activity and price levels, it helps traders understand if the market is trending, consolidating, or reversing. This can guide in setting trading strategies and managing risks.
Is the market profile the same as the volume profile?
No, the market profile and volume profile are not the same technical analysis tools. A market profile combines price, time, and volume to create a chart that shows how long the market traded at specific price levels. The Volume Profile indicator, on the other hand, focuses solely on the volume of trades at different price levels. Market Profile gives a macro view of market dynamics, whereas Volume Profile provides a micro perspective based on trading volume at specific price levels.
What role does the initial balance play in market profile analysis?
The initial balance in market profile analysis is the price range established during the first hour of the trading session. It is considered an important indicator as it can set the tone for the rest of the day. A wide initial balance suggests a range-bound market, whereas a narrow initial balance can indicate a potential trend day.
Risk Disclosure: The information provided in this article is not intended to give financial advice, recommend investments, guarantee profits, or shield you from losses. Our content is only for informational purposes and to help you understand the risks and complexity of these markets by providing objective analysis. Before trading, carefully consider your experience, financial goals, and risk tolerance. Trading involves significant potential for financial loss and isn't suitable for everyone.