Simple Moving Averages (SMA) in Forex
The Simple Moving Average (SMA) is the most basic moving average tool for technical analysis in the forex markets. It is called ‘simple’ because it works on the average of a set of closing prices. This kind of average calculation is the most basic form and requires no technicality. The trend indicator generates a line graph that cancels price irregularities by adding the closing prices of the most recent periods and dividing them by the total number of periods.
How the Moving Average Indicator Works
The SMA indicator is calculated by taking a series of the most recent prices, adding these values together, and then dividing the sum by the number of data points. For example, if you were to calculate the 10-period SMA on a daily chart, you would first have to evaluate the sum of your chart’s ten most recent data points. These are the closing prices for the last ten completely formed candlesticks on your charts. After that, you divide this sum by 10, the number of candlesticks involved. The result is the 10-period SMA for the last completed period.
Now, let’s assume that an asset’s last ten data points were 80, 81, 81, 82, 80, 82, 89, 82, 82, and 83. The moving average price would add these figures together and divide by ten, resulting in an average closing price of 82.2. Then, each time a new data point becomes available, the moving average indicator “moves” so that the average is always based only on the last same number of variables. In this case, if the following number in the sequence was 86, the oldest rate (80) would be dropped, and the new average would equal 82.8.
The simple moving average formula simply works that way.
Calculating these figures on a 1-hour chart implies adding the data points for the last 10 hours. Most charting packages and trading platforms have the SMA indicator that automatically does these calculations as each new period emerges. However, there’s a good reason to understand how to calculate the simple moving average indicator on a trading chart. Learning how the indicator works means you can adjust, tweak, and eventually create different trading strategies as the forex market environment evolves. Ultimately, using the recent data points in the SMA indicator will help you figure out the overall market trend and find new trade opportunities.
How to Calculate Simple Moving Average in Forex Trading
Now, let’s explore more deeply how simple moving averages smooth out the price action in the forex market.
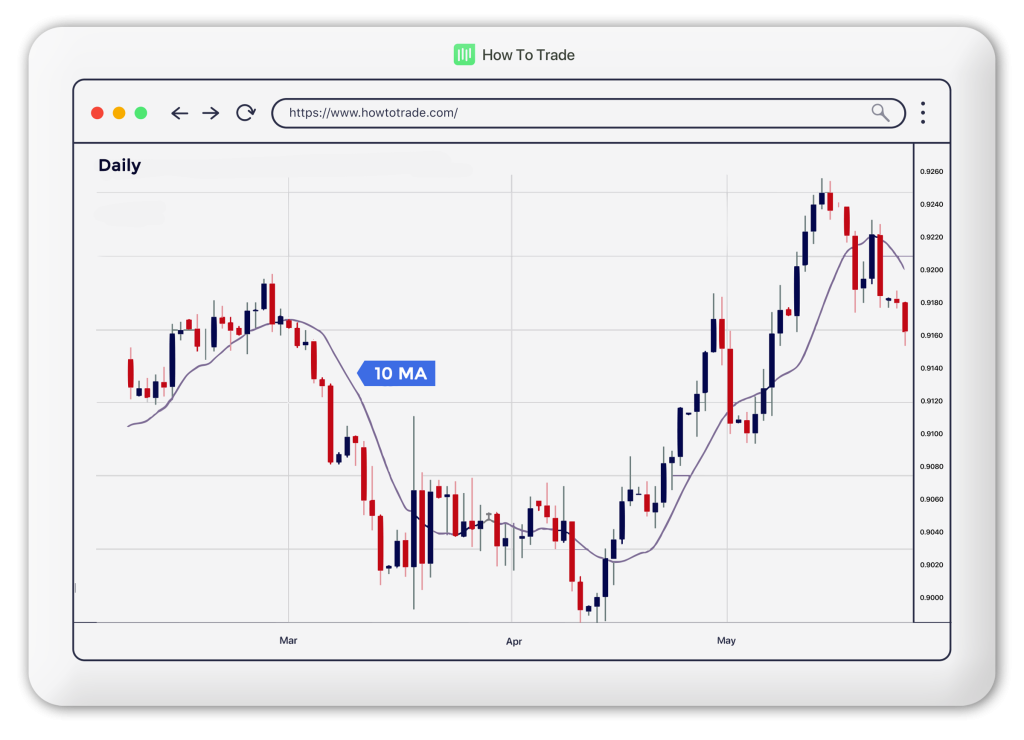
On the daily chart below, we will plot three different SMA’s time periods – a 10-period (short-term), a 20-period (medium-term), and a 50-period (long-term) simple moving average lines.
Let’s start with a 10-period SMA that projects on the price chart. Notice how the 10-period moving average follows the price action with a very smooth line. It will be the least smooth of our three different SMA considerations. Also, notice that the moving average line somewhat lags behind the price.
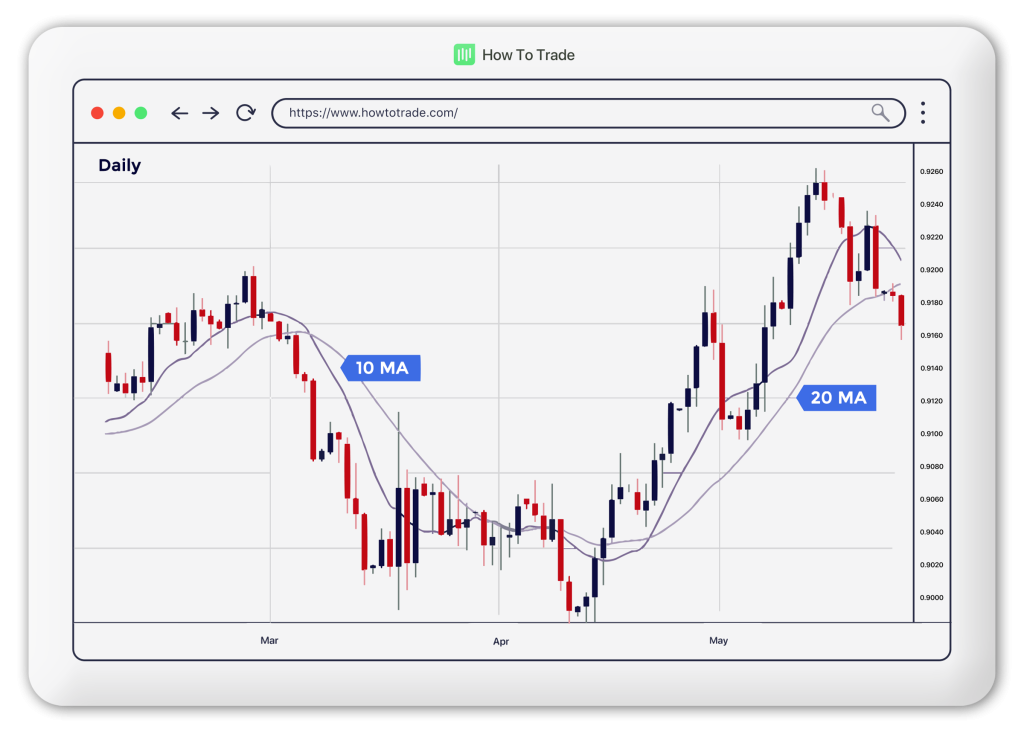
Take a look at the 20-period SMA on the same chart. It is smoother and lags further behind the price than the 10-period SMA. This isn’t particularly surprising when you consider it takes the last 20 periods rather than the last 10 into account. For this reason, technical analysts say that the 20-period MA technical indicator is a slower moving average (and more accurate) than the 10-period MA.
Finally, consider an asset’s past performance on the 50-period SMA. It becomes evident that the line is much smoother, with a more significant lag behind the price.
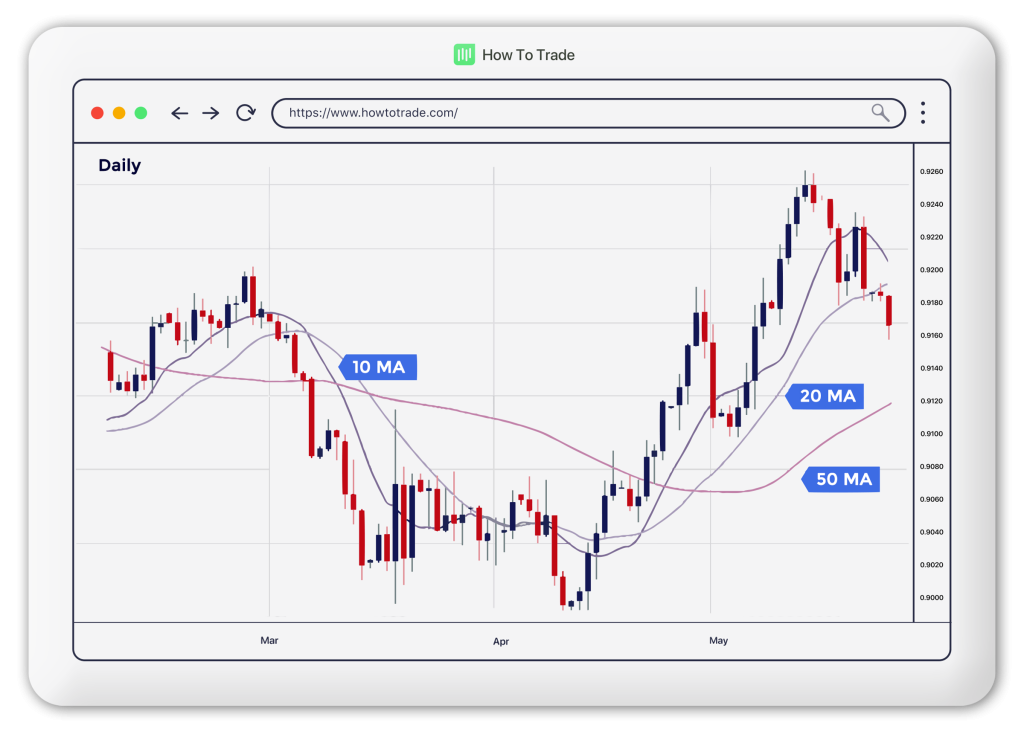
Among the three moving averages technical indicators, the 50-period SMA is the slowest, while the 10-period SMA is the fastest. Also, the longer the SMA period, the more it lags behind the price, implying a more even weighting. At the same time, the longer the period you use for the SMA, the slower it reacts to price fluctuations and market news.
How to Use the SMA Indicator on a Trading Platform
The SMA indicator appears as default on most trading platforms. This means you do not have to download the tool separately before integrating it with your trading platform. Once launched, the indicator pops open a dialogue to customize its settings. Among its adjustable variables are the period, shift, and “apply to.” Let’s briefly look into these settings.
1. Period
As already discussed, a period represents a candlestick on any timeframe you pick. The “period” variable allows you to determine the number of periods you wish to apply to your SMA. In other words, it considers the number of recent hours on an hourly chart, the number of recent days on a daily chart, and so on. Smaller values produce a faster-moving chart, while larger values produce a slower chart. However, a faster-moving chart is more reactive to price changes. Traders look out for a balance where the number of periods produces a chart smooth enough to clear out price irregularities but fast enough to detect price changes.
2. Shift
The shift variable is not very crucial. Placing an input shifts the SMA in the direction of the time-axis on the graph. Therefore, a positive value will shift the SMA to the right, while a negative value will shift it to the left. For beginners, we recommend using the default value of 0.
3. Apply To
The “apply to” variable comes with a list of options to pick. They are the close price, open price, high price, low price, median price, typical price, and weighted close price. The median price is the average of high and close. The typical price is the average of high, low, and close. Lastly, the weighted close price is the average of high, low, close, and close. The default settings apply to close, and we recommend new traders leave it at this option.
Simple Moving Average Trading Strategies
A very basic SMA trading strategy is to open two SMAs of different periods on your chart. The cross between the SMAs can generate buy and sell signals. In this scenario, the shorter-period SMA is the signal line that indicates whether to buy or sell. When the shorter-period SMA crosses above the longer-period SMA, this indicates a buy. Conversely, when the shorter-period SMA crosses below the longer-period SMA, it suggests a sell trade.
Another simple moving average strategy involves the use of just one MA line on your chart. If the price crosses above this line, that’s your buy signal. And if the price crosses below this line, that’s your sell signal.
However, remember that the SMA works based on historical price data, and historical values do not always determine future price action. Therefore, use the indicator with caution. This simple crossover strategy is a basic way, among several others, to trade with the SMA. Traders often combine the SMA with other indicators to generate more accurate signals.
Benefits of the Simple Moving Average
- The simple moving average helps eradicate market noises caused by irregular price fluctuations, making it a favorite among beginners and expert traders. Some of its benefits are as follows.
- The primary advantage of the SMA lies in its ability to smooth out price data over a specified period. This smoothing effect helps eliminate short-term fluctuations, making it easier for analysts to identify a security’s overall trend.
- Unlike more complex indicators, the SMA is straightforward to interpret. By observing the relationship between the current price and the SMA, traders can quickly grasp whether a security is in an uptrend, downtrend, or range.
- SMAs help identify potential support and resistance levels. When the price is above the SMA, it may act as support. Similarly, when the price is below the SMA, it may serve as resistance.
- Crossovers between short-term and long-term SMAs can signal potential trend reversals. A golden cross where the short-term crosses above the long-term SMA may indicate the beginning of an uptrend, while a cross of the short-term SMA below the long-term SMA suggests a potential downtrend
- The SMA can also be used as part of a risk management strategy. By setting stop-loss orders based on the SMAs, traders can limit losses during adverse market conditions.
Limitations of the Simple Moving Average
The SMA also has some limitations that affect its accuracy in identifying trade opportunities in the market. Some of the limitations of the SMA are as follows.
- The SMA is a lagging indicator. Since it relies on historical prices, it may not provide timely signals for fast-moving markets, causing traders to miss opportunities.
- In ranging markets, SMAS can generate false signals, leading to whipsaws. Traders may enter or exit positions based on crossovers that do not result in sustained trends.
- The SMA gives equal weight to all data points within the chosen period, regardless of their chronological order. This can be a drawback when market conditions change.
- Finally, the effectiveness of the SMA is highly dependent on the chosen time period. Different securities and market conditions may require adjustments to the SMA parameters, making it somewhat subjective.
Key Takeaways
- The SMA is a tool that smoothens market volatility by evaluating the average of a set of recent periods on the price chart.
- A longer-period SMA generates a smoother line that is less reactive to price changes.
- A shorter-period SMA results in a less smooth line that reacts more favorably with price fluctuations.
- The SMA comes as a default on most trading platforms.
- A simple strategy to trade the SMA is a crossover between two different periods.
- The SMA works based on historical data and does not always accurately predict future price movements.
Conclusion
Instead of merely staring at the price chart, the Simple Moving Average allows traders to get a clearer picture of price action and better understand the next possible direction of price action in the forex markets. By adding the SMA to your toolkit, you can better predict trend direction and the future performance of assets.
Combining the SMA with other technical analysis indicators like support and resistance levels, the exponential moving average (EMA), RSI, etc, helps improve results. But as with other indicators, this technical indicator isn’t perfect. In fact, simple moving average trading strategies are susceptible to spikes that can give traders a false buy and sell signal.
In the next lesson, we will introduce you to another moving average indicator -the exponential moving average indicator, that can further improve your trading prowess and profitability. See you on the next one.


Trade 1 Lot for just $2.5 commission*
- Trade 1,000’s of global markets.
- 0% deposit and withdrawal fees.
- Rapid funding turn-around times.
- Trade on MetaTrader 4 and 5.