


- Correlation in trading measures the relationship between two variables, and in financial markets, it’s used to understand the movement of securities together.
- There are three types of correlation trading: positive correlation (assets move in the same direction), negative correlation (assets move in opposite directions), and no correlation (assets move independently), each offering different risk and reward dynamics.
- Trading Correlation involves identifying correlations between two assets and employing strategies based on these relationships for profit enhancement or risk hedging, with an emphasis on staying informed about changing correlations and adapting strategies accordingly.
Have you ever noticed certain markets tend to move together as though they were spying on each other? Some even move in the opposite direction. This phenomenon is called “Correlation.” Why does this happen, and how does it affect your overall trading success? That’s why we’ve put this article together.
In this article, we will go through all you need to know about correlation trading. Here are some of the key topics we are going to cover:
- The definition of correction in trading.
- How correlation trading works.
- How you can use the correlation trading strategy across different markets.
What is a Correlation in Trading?
Correlation is a mathematical term that measures the relationship between two variables or datasets, similar to how children’s height tends to correlate with the height of their parents. This concept also applies to various aspects of trading, including how different trading strategies perform together. Ideally, strategies should not yield negative results simultaneously; rather, they should make profits and losses independently of each other.
Correlation is especially relevant in the context of financial markets, where it gauges the relationship between two securities, such as stocks, bonds, ETFs, mutual funds, or indexes. The degree to which these securities move together is a key focus. Note, however, that these assets are not necessarily from the same asset classes.
The correlation coefficient, a statistical measure, varies between -1.0 and +1.0. When the coefficient is +1, it indicates that two currency pairs or any other financial instruments will consistently move in the same direction.
Conversely, a coefficient of -1 suggests that the pairs will always move in opposite directions. A zero coefficient denotes a lack of any predictable relationship, signifying a completely random movement between the currency pairs. This measure is crucial for understanding and interpreting currency pair movements in financial markets.
How Does Correlation Trading Work?
Correlation trading involves understanding and utilizing the average correlation of an instrument or identifying currency pairs that exhibit similar or opposing movements. Essentially, it’s about exploiting the statistical relationship between two or more financial instruments. For investors, correlation trading offers opportunities to diversify their portfolios, hedge risks, or enhance returns, by keenly understanding the factors that influence the price movements of different assets or currency pairs.
The effectiveness of correlation trading hinges on the ability to promptly identify a breakdown in these relationships to avoid severe losses or secure significant profits. This requires a deep understanding of the market and the ability to predict when the future realized correlation among the stocks of a particular index will be greater or less than the implied correlation level.
This implied level is often derived from derivatives on the index and its individual stocks. Traders often balance their strategies by aligning positively and negatively correlated assets, thereby mitigating overall risk.
Asset correlation, as a concept, serves as a key risk management tool, aiding in hedging, diversification, and the formation of profitable trading strategies. This approach requires traders to use several asset correlation methods and strategies, always with an eye on the changing dynamics of the market.
3 Main Types of Correlation Trading
The following are the three primary types of correlation trading pivotal for investors and traders: positive, negative, and no correlation.
1. Positive Correlation
This occurs when assets move in the same direction—when one rises, the others tend to rise as well, and vice versa. A positive correlation indicates a strong, linear relationship between the assets, providing opportunities for consistent returns and portfolio diversification. However, it also poses risks, as a downturn in one asset can lead to amplified losses across all positively correlated assets.
For instance, EUR/USD and GBP/USD often move similarly.
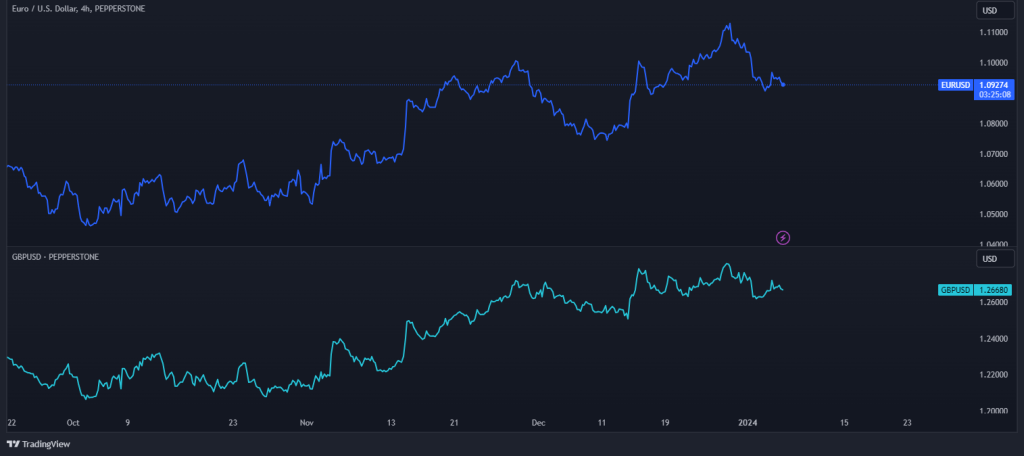
In stocks, technology companies like Apple and Microsoft might exhibit a positive correlation. In commodities, correlated assets include gold and silver, crude oil and natural gas, wheat and corn, and many others.
In addition, many traders find less predictable correlations between assets, such as NASDA100 and DAX30 or Japanese Yen versus US stocks.
2. Negative Correlation
Also known as inverse correlation, this type refers to assets moving in opposite directions. One asset’s rise corresponds to another’s fall. This low correlation relationship is crucial in risk management and hedging strategies, as holding negatively correlated assets can help offset potential losses, thereby reducing overall portfolio risk. The precise selection of negatively correlated assets is vital for effective risk mitigation.
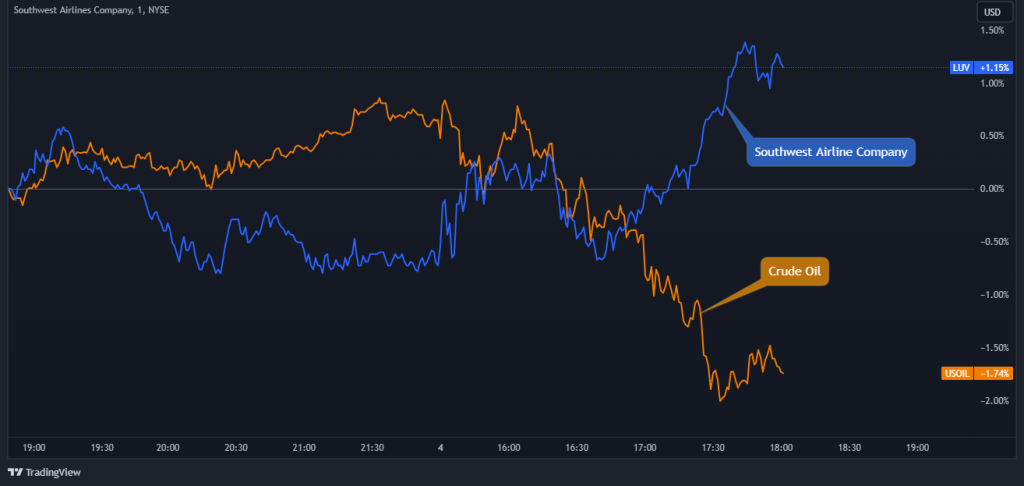
Some good examples of negative correlation include Crude Oil and Airline Companies Stocks, which typically move in opposite directions (as you can see in the chart above). Similarly, a utility company might negatively correlate with a technology stock during certain market conditions.
3. No Correlation
Here, when there’s zero correlation, the assets have little to no linear relationship, and their movements are essentially independent. A no-correlation scenario is instrumental for diversification, adding a layer of independence and potentially reducing overall portfolio risk. It also opens up unique trading opportunities for risk-tolerant traders to capitalize on the individual dynamics of each asset.
In stocks, a tech stock and a local restaurant chain might have no correlation as well. Instead of memorizing these correlations, you can easily refer to our Forex correlation cheat sheet whenever you want.
Asset correlation, as a concept, serves as a key risk management tool, aiding in hedging, diversification, and the formation of profitable trading strategies. This approach requires traders to use several asset correlation methods and strategies, always with an eye on the changing dynamics of the market.
How to Use the Correlation Trading Strategy?
Having a thorough understanding of how certain markets are correlated can help you make profitable decisions or even avoid some unnecessary losses. If you’re willing to take your new knowledge a step further, here’s how to trade two positively correlated markets:
To get started with this correlation trading strategy, we have to set up our chart properly on TradingView, or your chosen trading platform. In this example, we will be using the Coca-Cola and Pepsi-Cola stocks, which are, obviously, highly correlated assets.
So, the first thing you want to do is to set up your chart as below:
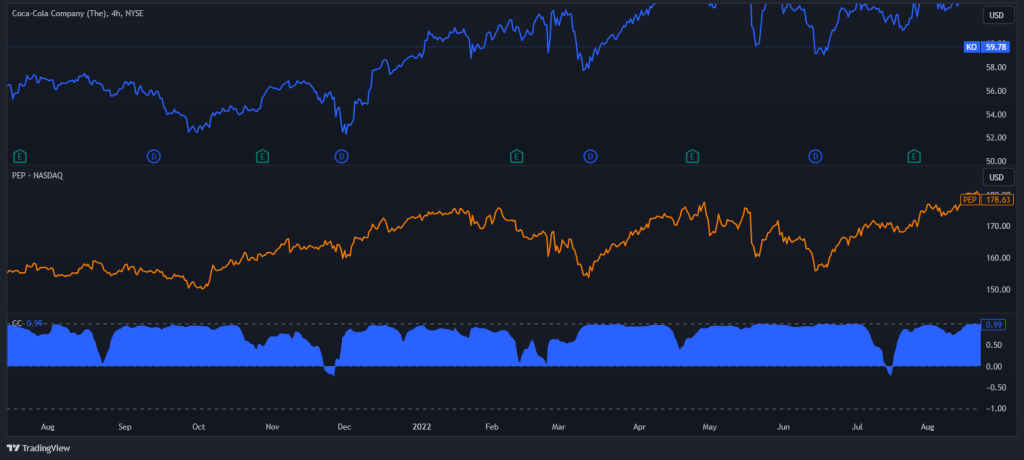
What we’ve basically done in the chart above is to use the compare tool on trading view to visualize how the PepsiCo stock compares with the Coca-Cola stock. Additionally, we also included the “correlation coefficient” indicator to help us recognize trading opportunities.
After setting up our chart, the next step is to wait for a deviation from the correlation. Here’s how it works: PepsiCo and Coca-Cola move in tandem almost all the time. However, there are times when they diverge. These times, we often place two different trades (without stop losses), hoping to trade them back into correlation, with one trade ending in a slight loss while the other trade ending in more profit.
Here’s how it looks on the chart:
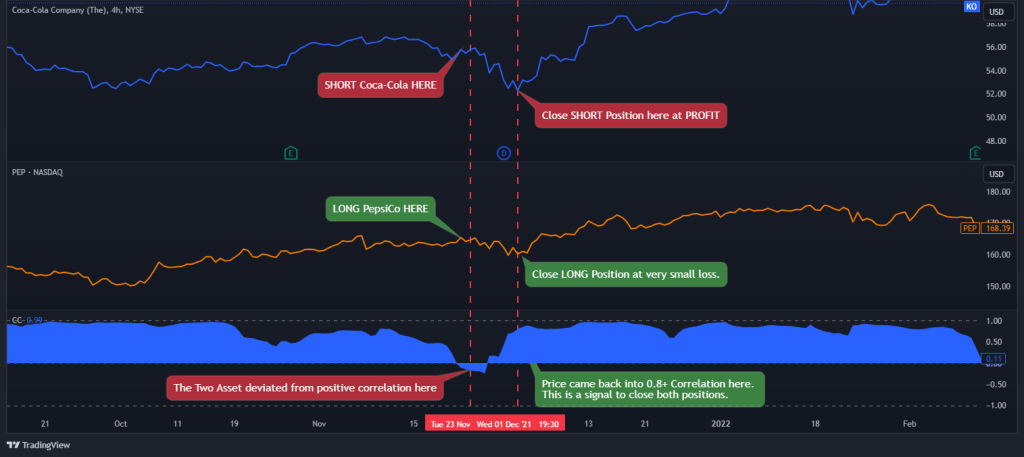
From the above chart, we saw that there was a “Crack in correlation” in these two assets. In that case, we will SHORT the Coca-Cola stock and LONG the Pepsi Co. We will close both positions when the price hits 0.8+ correlation. From the example above, we can see that the Coca-Cola trade closed with much profit, while we closed the PepsiCo trade with a very small loss. Overall, we made some profit.
How to Get Started with Correlation Trading?
In sum, the correlation strategy has existed for a long time. And for many, this strategy has been highly successful. So, how can you get started? Simple, you need to find two correlated (or no) assets, and build a system around these two assets.
You can then follow these two correlated assets on a price chart or a watchlist. Either way, the idea is pretty simple – you use the correlation between the assets to identify trade opportunities.
But remember that, like all trading strategies, correlation trading involves risks. Losses are inevitable, and there’s no guarantee of profit. So, it’s important to understand and prepare for the potential downsides as well as backtest your correlation trading strategy before you apply it in live markets.
Frequently Asked Questions about Correlation Trading
Here are some frequently asked questions on the correlation trading strategy:
What’s the most popular asset correlation?
The most popular asset correlations are typically found between currency pairs in Forex trading. For example, EUR/USD and GBP/USD are known to have a high positive correlation. In the stock market, sectors or industries may move in correlation, such as technology stocks or oil companies.
What is inverse correlation?
Inverse correlation, also known as negative correlation, is when two asset prices move in opposite directions. If one asset’s value goes up, the other’s goes down, and vice versa. In finance, an inverse relationship is quantified by a correlation coefficient close to -1. Inverse correlations are particularly useful in hedging strategies.
Why does market correlation change?
Market correlation changes due to a variety of factors, including shifts in economic policies, changes in market sentiment, geopolitical events, and variations in supply and demand dynamics. As these factors impact one asset differently from another, the degree and direction of their relationship can change over time.
Risk Disclosure: The information provided in this article is not intended to give financial advice, recommend investments, guarantee profits, or shield you from losses. Our content is only for informational purposes and to help you understand the risks and complexity of these markets by providing objective analysis. Before trading, carefully consider your experience, financial goals, and risk tolerance. Trading involves significant potential for financial loss and isn't suitable for everyone.