Downloads
Naked Trading Strategy (Complete Guide)
False Breakout Cheat Sheet
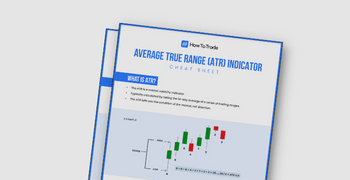
Average True Range (ATR) Indicator Cheat Sheet
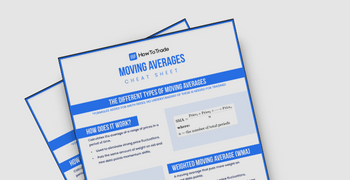
Moving Averages Cheat Sheet
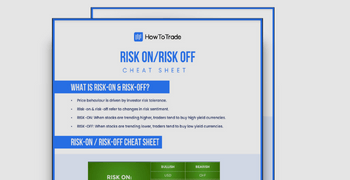
Risk-On Risk-Off Cheat Sheet
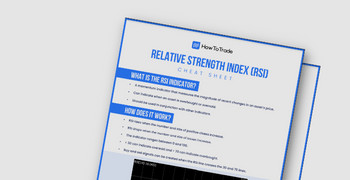
Relative Index Strength (RSI) Cheat Sheet
Stochastic Indicator (Strategy Guide)