How to Use Fibonacci Retracements To Place Stop-Loss
We have now paired the Fibonacci retracement levels with various technical tools to find trading opportunities in financial markets and in forex trading. This powerful combination includes the use of Support and resistance levels, Trendlines, and insightful Candlestick Patterns. In the previous lesson, we also saw how to place accurate take-profit orders to maximize and achieve your profit targets.
However, the application of the Fibonacci tool extends beyond just identifying entry points. This lesson is dedicated to guiding you on how to strategically set your stop-loss orders when trading with Fibonacci levels.
Remember Stop-Loss Orders?
Stop-loss orders are crucial lines that shield you from substantial losses in a single trade, especially when market trends turn unexpectedly against your position. Understanding the right placement of these orders is key to effective risk management.
Neglecting this could lead to undue frustration, where you might find yourself unfairly blaming Fibonacci’s methodology.
How to Use Fibonacci Retracement Levels to Place Your Stop Loss?
While it’s common for traders to leverage Fibonacci ratios for pinpointing entry points in currency pairs, a significant number of day traders avoid setting take-profit orders to avoid capping their earning potential. Consequently, the strategic use of Fibonacci lines becomes even more vital for placing stop-loss orders.
With this perspective, we will now explore two distinct methods for using the Fibonacci retracement tool. These approaches are designed to help you effectively position your stop-loss orders, a critical step in managing risk and safeguarding your investments.
1. Place Stop Loss Past the Fibonacci Retracement Level
The proper placement of the stop-loss order is crucial to managing your risk and protecting your fund if the market price goes against you. Thus, the Fibonacci retracement tool can be a great help to experienced and new traders in determining key levels of stop loss.
The first method is to place a stop loss right after going through Fibonacci numbers. Meaning if you planned to take a short position and enter at the 38.2% Fibonacci level, then you’d place your stop loss past the 50% Fibonacci level.
If you planned to enter at the 50.0% Fibonacci level, then you’d place your stop loss past the 61.8% Fibonacci level. And, If you planned to enter at the 61.8% Fibonacci level, then you’d place your stop loss past the 78.6% Fibonacci level.
This concept might seem straightforward, but let’s delve deeper with a practical example. Consider a 30-minute GBP/USD chart for better understanding.

As you can see in the chart above if you had shorted the GBP/USD at the 38.2% you could have placed your stop-loss order just past the 50.0% Fibonacci level. Then, if the price breaks above the 50.0% Fibonacci retracement line, you’ll be out of the position with a minor loss.
The reasoning behind this method of setting stops is that you believed that the 38.2% level would hold as a resistance point and the currency pair price would move in your direction. Therefore, if the price were to rise beyond this point, your trade idea would be invalidated.
However, this method isn’t without its challenges. Its effectiveness hinges on the precision of your entry point.
Setting a stop just past the next Fibonacci retracement level assumes that you are confident that the support or resistance area will hold. And, as we pointed out earlier, using drawing tools on your trading platform isn’t necessarily science.
The truth is that you never really know. The market might shoot up, hit your stop, and eventually go in your direction. We are not saying that this will happen. But it might. So, our advice is to apply this stop placement technique primarily for short-term, intraday trades where market behavior can be more predictable.
2. Place Stop Loss Past Recent Swing High & Swing Low
Now, if you like to be a little safer, another way to set your stops would be to place them past the recent Swing High or Swing Low.
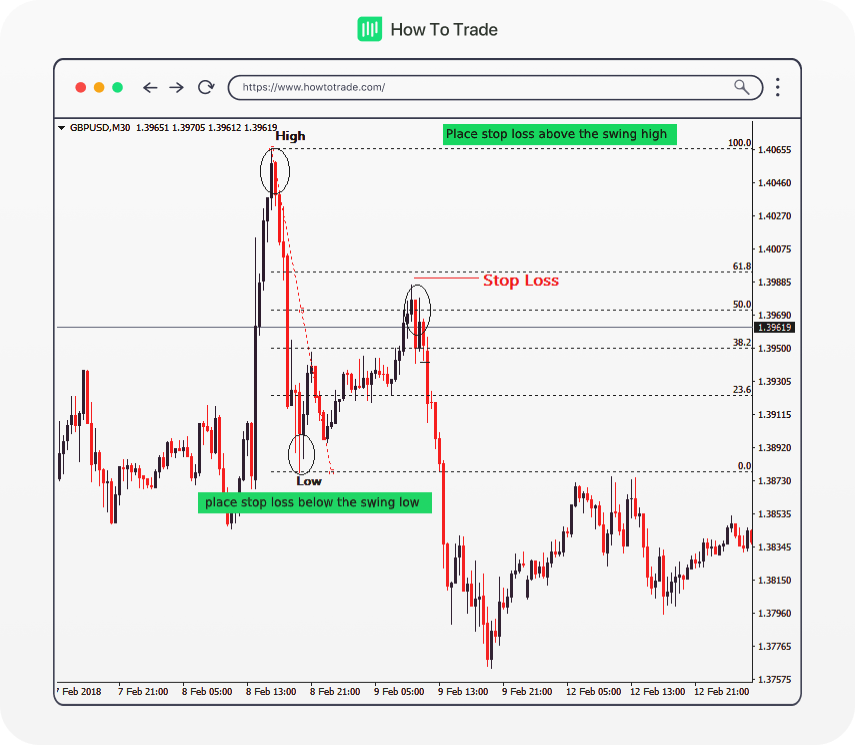
For example, when the price is in an uptrend, and you’re in a long position, you can place a stop loss just below the latest Swing Low, which acts as a potential support level. In the opposite direction, when the price is in a downtrend, and you’re in a short position, you can place a stop loss just above the Swing High which acts as a potential resistance level.
Many successful traders advocate for this method of stop-loss placement, as it tends to provide your trades with more breathing space. This approach increases the likelihood of the market moving in favor of your trade.
In our case, if the currency prices were to go past the Swing High or Swing Low, it might indicate that a trend reversal is already in place. This means that your trade idea or setup is already invalidated and that you’re too late to jump in.
Option 1 vs Option 2 – Which One is Better?
Truth be told, it is entirely up to you to decide which method you should go for. Just remember that neither of the methods is a sure thing, and you shouldn’t rely solely on the Fibonacci sequence as support and resistance points as the basis for your stop-loss placement.
But what both of these Fibonacci levels methods can do when combined with other tools, is tilt the odds in your favor, give you a better exit point when market trends are against you, more room for your trade to breathe, and possibly a better reward-to-risk ratio trade.
So it’s worth a try, right?
Key Takeaways
- Combining Fibonacci retracement levels with other technical analysis tools like Support and Resistance levels, Trendlines, and Candlestick Patterns enhances trading strategies in financial and forex markets.
- Stop-loss orders are essential for managing risk and preventing substantial losses, especially when market trends unexpectedly turn against a trader’s position.
- A recommended method for setting stop-loss orders involves placing them past the next Fibonacci retracement level, contingent upon the entry point’s Fibonacci level, to manage risk and minimize potential losses.
- An alternative stop-loss placement strategy is to set them past recent Swing Highs or Lows, providing trades more room and potentially increasing the likelihood of market movements favoring the trade.
- Neither stop-loss method is foolproof, and traders should not rely solely on Fibonacci levels for stop-loss placement; however, combining these methods with other tools can improve trade outcomes and risk-reward ratios.
Bottom Line
Fibonacci retracements are great for many things, including the setting of stop loss levels and price targets. Many traders rely on these fib levels to get a “perfect entry,” and identify potential support and resistance levels for their stop placement method.
Using Fibonacci retracement alone for your trading decisions, though, isn’t what we recommend. You need to combine it with other indicators or trading tools to get the high probability setups.


Trade 1 Lot for just $2.5 commission*
- Trade 1,000’s of global markets.
- 0% deposit and withdrawal fees.
- Rapid funding turn-around times.
- Trade on MetaTrader 4 and 5.