How to Use Fibonacci Retracement with Trend Lines?
As you already know, Fibonacci retracement levels work best when the forex market is trending. So what better tool to combine it with other than trend lines. Being such an important part of technical analysis, when trend lines are combined with the Fibonacci retracement tool, this combination of technical indicators can produce trades that have the HIGHEST probability of winning in forex trading.
Intrigued? I don’t blame you! Let’s see how this can be done.
Combine Fibonacci Retracement With Trend Lines
The main aim of the Fibonacci retracement levels and the use of Fibonacci trading, in general, is to signal the most reliable support and resistance levels. In trading, the Fibonacci sequence levels are commonly used by many traders in financial markets, and the most important of all is the Golden Ratio.
But what if I told you that you can confirm the signal by drawing a trend line and using it as a confirming technical analysis tool. And if the trend line and the Fibonacci levels collide, this point may become the most forceful support or resistance level.
As we learned in the previous lessons, a trend line helps you to identify the trend direction. Fibonacci retracements, on the other hand, are simply horizontal lines used by many traders to identify high and low points in a specified time frame. When these two technical analysis tools are combined, you can find key levels and entry points in forex trading.
Technically, the first thing you need to know is how to draw key Fibonacci ratios and a trend line on charting software. But these technical indicators are available on almost every trading platform so you should find your way around easily. If needed, you can go back to the trend lines lesson, and learn how to draw trend lines when analyzing the forex market.
The next and most important thing you need to know is to identify trends and combine Fibonacci retracement with trend lines on a forex price chart. But, that is a skill that comes with practice so the more you trade using Fibonacci retracements and a trend line, the better forex trader you can become.
Let’s see an example of how these two tools work together.
An example – Combining Fibonacci Retracement Levels With Trend Lines on a Forex Chart
OK, so let’s see how Fibonacci retracements with trend lines actually look on a forex chart. As an example, below is a monthly chart of EUR/USD with Fibonacci ratios and a trend line.
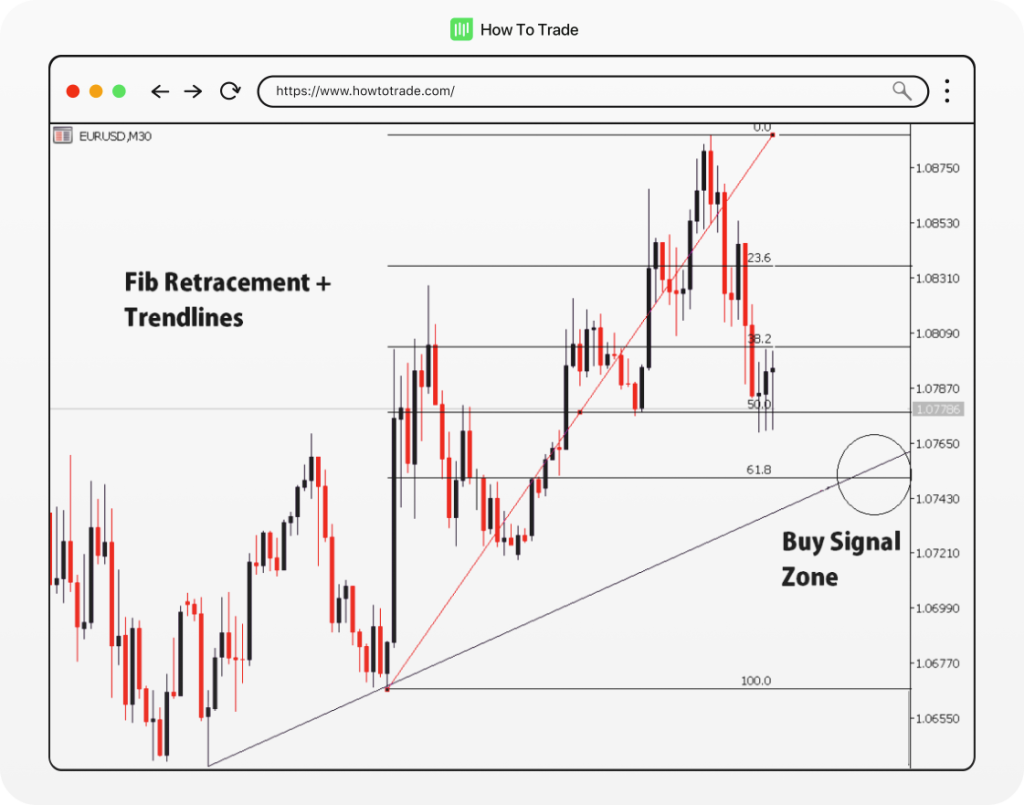
As you can see, the price has been respecting a short-term rising trend line over the past month. If you look even closer, you’ll see that we plotted the Fibonacci retracement levels by using the Swing Low and the Swing High.
Notice how the trend line and Fibonacci levels intersected at the 61.8% Fibonacci level? Could these key Fibonacci ratios serve as potential support levels? There’s only one way to find out!
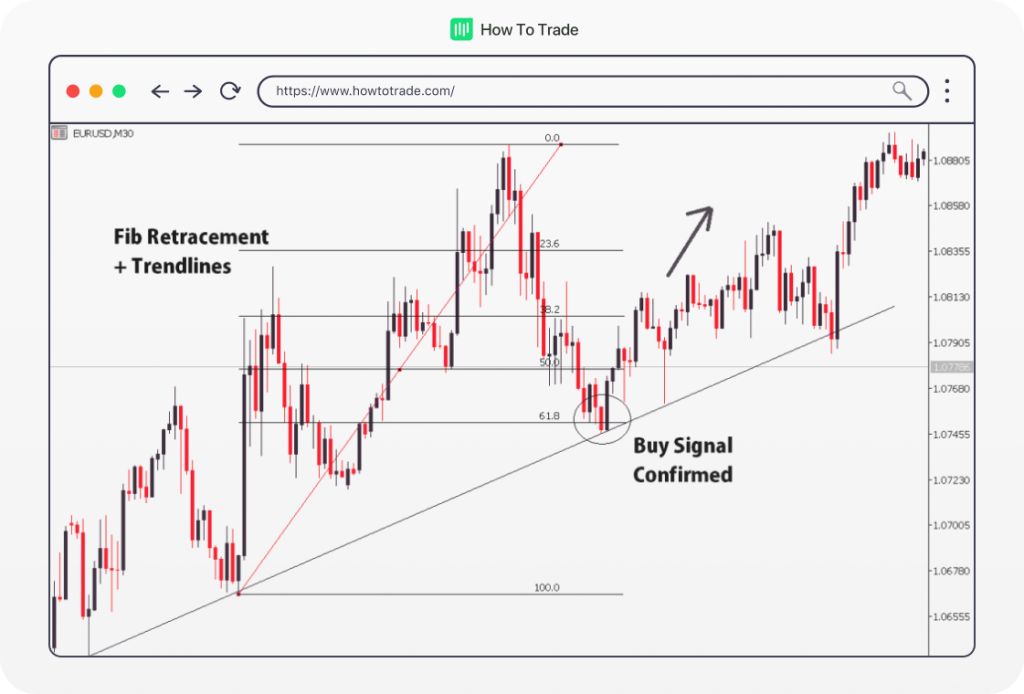
Voila! If you had set some orders at that level where the market price hits the Fibonacci retracement level and the trend line, you would have had the perfect entry! As you can see, from this level, the currency pair had a nice uptrend.
And that’s what the combination of a trend line and horizontal support or resistance Fibonacci levels can do! It’s an extremely useful technical analysis strategy when both indicators act as confirming indicators. It’s good to have this in your forex toolbox, aye?
How to Trade Fibonacci Retracement Levels With Trend Lines
Generally, there are many strategies for trading Fibonacci retracements. Later on, in this course, we are going to learn more methods to use Fibonacci retracements with other technical indicators rather than a trend line. We will learn how to combine Fibonacci retracement lines with support and resistance levels and how to combine Fibonacci retracement ratios with different candlestick patterns.
But for now, let’s recap how you can do this in practice and combine the Fibonacci retracement tool and trend lines. Stick to the following 6 points and you can’t go wrong.
- Find a Trending Currency Pair
- Draw a Trend Line
- Draw Fibonacci retracement levels From Swing low to swing High
- Wait for the Price level to Hit Trend Line and the Fib retracement level
- Place your trade in the Forex market
- Set a profit target in the next support or resistance Fibonacci ratio level and exit the trade
Key Takeaways
The most important takeaway should be that combining Fibonacci Retracement Levels and trend lines is a great trading strategy that will give you lots of trading ideas. By using this trading strategy, you are basically looking to find areas where the price of an asset stops near or at a trend line with one of the Fibonacci golden ratio levels.
In the next lessons, we learn more about using Fibonacci trading tools and use these magical Fibonacci numbers to develop a solid trading strategy…


0% Commission Accounts
- Trade 1,000’s of global markets.
- 0% deposit and withdrawal fees.
- Rapid funding turn-around times.
- Trade on MetaTrader 4 and 5.