How to Use Fibonacci Retracement Levels with Support and Resistance
As highlighted in the previous chapter, the Fibonacci retracement tool is incredibly useful, yet it shouldn’t be the sole tool in your trading arsenal. Integrating Fibonacci retracement levels with other technical analysis indicators can significantly amplify your profit potential.
In practice, the combined use of these tools can work wonders. The Fibonacci numbers, deriving their name from the famed Italian mathematician Leonardo Fibonacci, represent a unique sequence that might astonish you with its accuracy and utility in forex trading.
In this short lesson, we are going to show you how to use Fibonacci ratios and combine them with support and resistance levels.
Combining Fibonacci Retracement with Support and Resistance is a great way to enhance your trading strategy.
Nick Quinn, Market Analyst at HowToTrade.com
Fibonacci Retracements Combined With Support and Resistance Levels
Trading with a combination of Fibonacci retracement levels and support and resistance is straightforward. The key is to identify zones where these elements converge.
When Fibonacci retracement levels align with existing support and resistance areas, their efficacy is amplified. This alignment, coupled with the focus of numerous traders on these price points, significantly heightens the probability of price reactions at these junctures.
This can be largely attributed to the herding behavior in financial markets, and especially in the forex market. Nowadays, many forex websites and trading platforms offer a built-in feature where you get access to Fibonacci ratios so any trader can find support and resistance profit targets.
With that being said, you need to know how to identify the right support and resistance horizontal lines and apply Fibonacci retracements levels to a trading chart. Fortunately, this task is simple on even the most basic charting software, which typically includes technical indicators such as Fibonacci retracement lines, moving averages, RSI, and more. The beauty of these software lies in their automation; when you draw a Fibonacci sequence on a chart, the platform calculates the retracement levels for you, eliminating the need for manual computation.
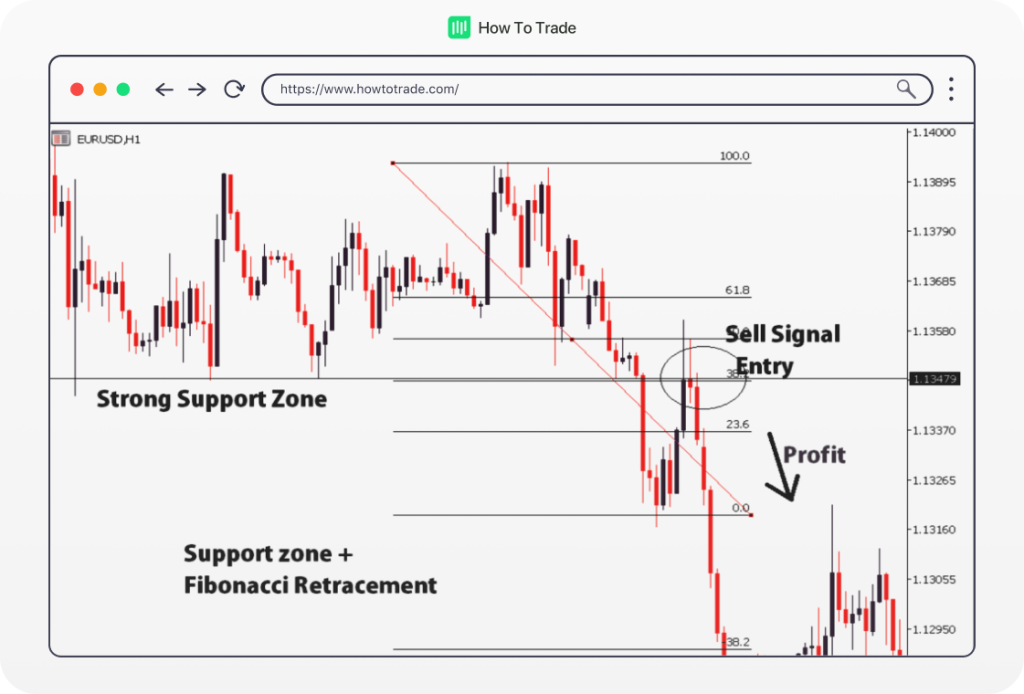
But that’s enough talk. Let’s see what combining support and resistance levels with Fibonacci retracement levels looks like on an actual Forex price chart. As an example, below we have drawn Fibonacci retracement levels on an hourly price chart of EUR/USD.

Observing this chart, it appears to be in a downtrend. You might be considering a short position on EUR/USD, particularly below the 38.2% Fibonacci level. The crucial questions now are when and where to enter the trade…
Now, it’s time to deploy your Fibonacci retracement tool, setting your Swing Low and Swing High. The chart becomes far more informative with those Fibonacci ratios, right? Upon closer inspection, the price level of 1.13479 emerges as a robust support level, coincidentally aligning with the 38.2% Fibonacci retracement level. Coincidence? Likely not.
A good place to sell? It certainly seems so. If you are an active day trader who places your price targets at the next Fibonacci level, you could essentially close your position at the 23.6 or 0.0 Fib retracement levels.
Fibonacci Support and Resistance – Trust, and Always Verify
Let’s see what would have happened if you had placed an order around that 23.6 Fibonacci retracement level.
In this scenario, you would likely have been quite satisfied with the outcome. You can do the same setup on an uptrend as well. The point is to look for price levels that seem to have been areas of interest in the past. If you think about it, there’s a higher chance that the price retraces from these levels. Why?
Firstly, with traders looking at the same support and resistance levels, there’s a good chance that there will be a number of orders around those levels. In other words, these important Fibonacci ratios turn out to become significant price points as they are used by many forex traders.
Secondly, with many traders using the Fibonacci retracement tool, there is a big chance they are looking to jump in on these Fibonacci levels themselves. Although there’s no absolute guarantee that the price will rebound from these levels, this insight allows for greater confidence in your trading decisions.
Key Takeaways
- Fibonacci retracement levels, when combined with support and resistance, enhance forex trading strategies and profitability.
- The effectiveness of Fibonacci levels increases significantly when they align with other tools, such as existing support and resistance areas, due to widespread trader attention.
- Modern forex trading platforms automate the process of applying Fibonacci retracements, simplifying technical analysis for traders.
- The convergence of trader behavior around Fibonacci and support/resistance levels creates potential high-probability trading opportunities.
Bottom Line
At the end of the day, trading is all about probabilities and if you combine these two technical analysis tools, the chances are that the signals you get are more reliable. If you stick to those higher probability trades and use the Fibonacci golden ratio, then there’s a better chance you’ll come out the other (better) end.
After all, applying Fibonacci retracements can simply help you find entry and exit levels, and can be even more useful when combined with other technical indicators like support and resistance, and moving averages. Speaking of moving averages, let’s move on to the next course that will help you understand how to use a moving average line in your forex trading.


0% Commission Accounts
- Trade 1,000’s of global markets.
- 0% deposit and withdrawal fees.
- Rapid funding turn-around times.
- Trade on MetaTrader 4 and 5.