- Fibonacci Time Zones are a tool used in forex trading to identify potential future reversal and extension points in time.
- They are calculated based on the Fibonacci sequence and drawn as vertical lines on a price chart.
- Fibonacci Time Zones can be used for both entry and exit strategies, helping traders make well-timed decisions.
- Combining Fibonacci Time Zones with other Fibonacci tools and technical indicators can enhance their effectiveness.
While technical analysis tools like support and resistance levels, moving averages, and trendlines are commonly used to analyze price charts, there’s another tool that often goes unnoticed but can be incredibly powerful: Fibonacci Time Zones.
Fibonacci Time Zones are a lesser-known aspect of the Fibonacci sequence, which is widely used in trading to identify potential reversal and extension levels in price.
In this guide, we’ll explore how you can use Fibonacci Time Zones to pinpoint entry and exit levels and improve your overall trading performance.
What are Fibonacci Time Zones?
Before delving into how to use Fibonacci Time Zones effectively, it’s essential to grasp what they are and how they are calculated.
Fibonacci Time Zones are vertical lines that are drawn on a price chart to highlight significant time intervals. These intervals are derived from the Fibonacci numbers, a series of numbers in which each number is the sum of the two preceding ones (e.g., 0, 1, 1, 2, 3, 5, 8, 13, 21, and so on).
To plot the Fibonacci Time Zones, you start by identifying a significant price swing or trend on your chart. The process of adding the indicator works the same as using the Fibonacci Retracement tool, but vertically. This could be an uptrend or downtrend.
Once you’ve identified the starting point of the trend, vertical lines are automatically plotted at specific Fibonacci time intervals, and these lines represent potential future turning points in time.
Here’s what the indicator looks like on a price chart:

Obviously, the first few zones are going to be closer to your starting point. So, the further you go, the farther your future Fibonacci time zones will be.
Essentially, the Fibonacci time zone indicator was designed to identify potential price levels where the price might reverse using the Fibonacci sequence. However, unlike the standard Fibonacci retracement levels indicator, the Fibonacci time zone aims to find these levels using the price and time as the main catalysts for a shift in price sentiment.
How to Use Fibonacci Time Zones for Entry Levels
One of the primary ways traders use Fibonacci Time Zones is to pinpoint potential entry levels. Here’s how you can incorporate them into your trading strategy:
1. Identify a Trend
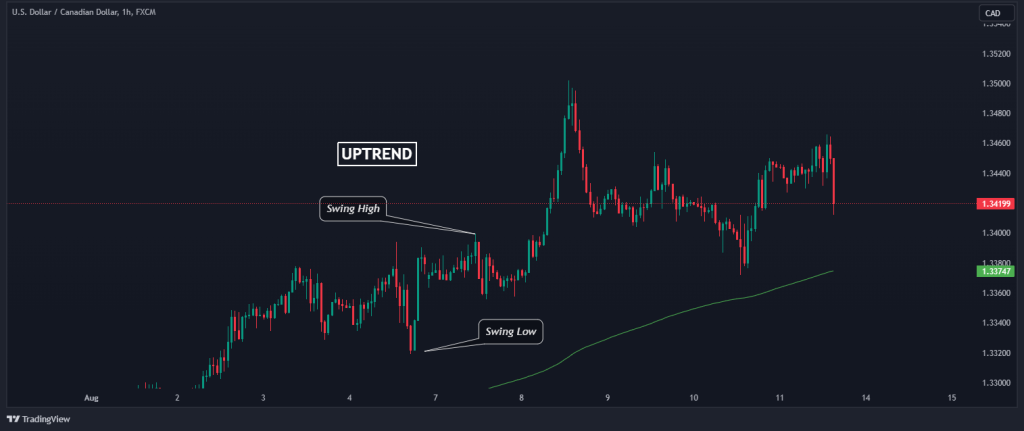
Start by identifying a clear and established trend in the forex pair, or any other financial asset you’re interested in trading. This could be an uptrend or a downtrend. A simple but effective method is to use the 200 EMA. Price is in an uptrend when it is above the 200 EMA and a downtrend when it is below it.
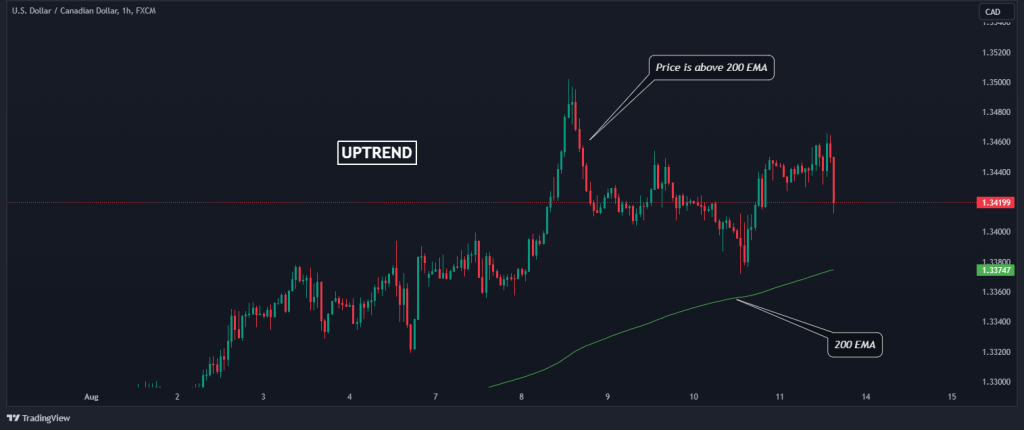
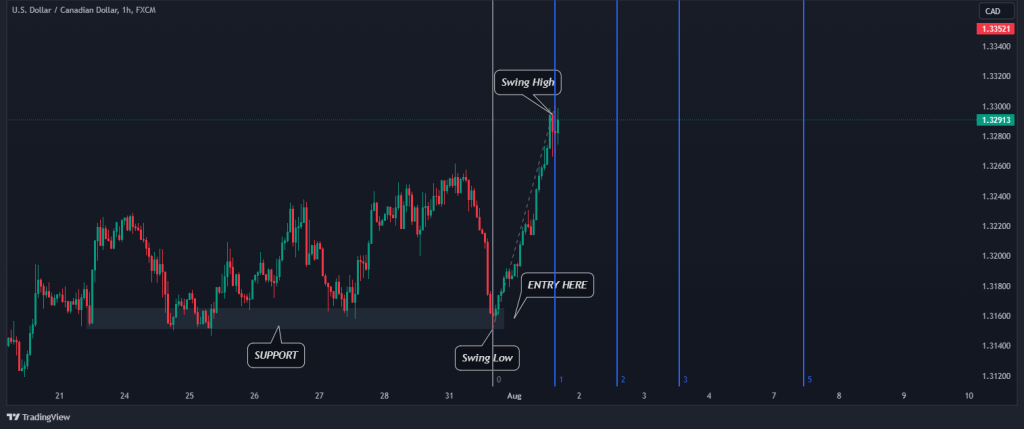
In the USDCAD hourly chart above, for instance, the price is above the 200 EMA, meaning we’re in a bullish trend.
2. Determine the Starting Point
Find the starting point of the trend, which is typically the most recent significant high or low in the price. For an uptrend, the starting point will be a significant swing low.
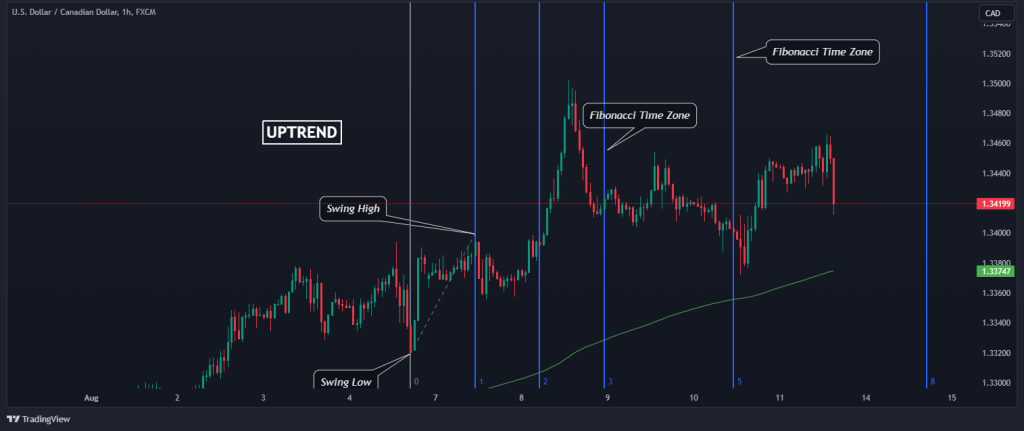
3. Plot Fibonacci Time Zones
Draw the Fibonacci Time Zones on your chart, extending them from the starting point. These lines will provide you with potential future time intervals where price reversals or significant moves are likely to occur.
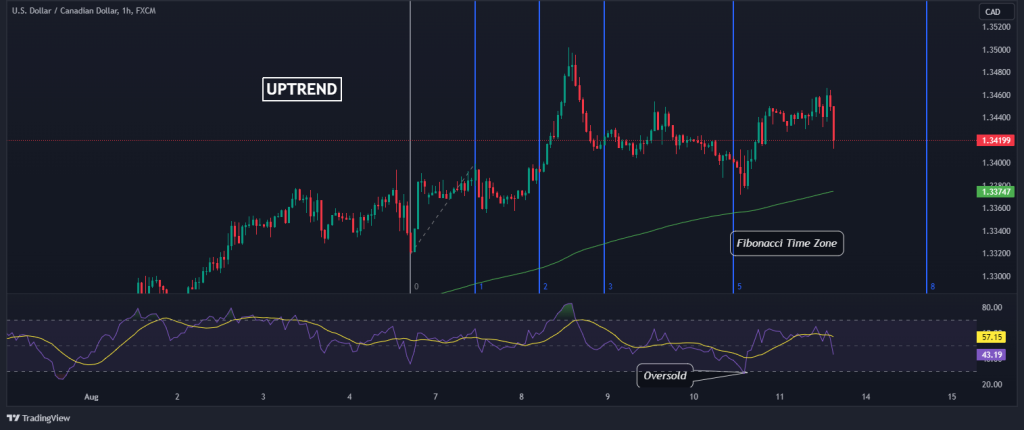
4. Wait for Confluence
To increase the accuracy of your entry levels, consider looking for confluence between the Fibonacci Time Zones and other technical tools. An intersection of Fibonacci Time Zones with a trendline, RSI, or a support/resistance level can be a strong signal for an entry. In our USDCAD example below, we get a signal from the RSI reaching its oversold zone.
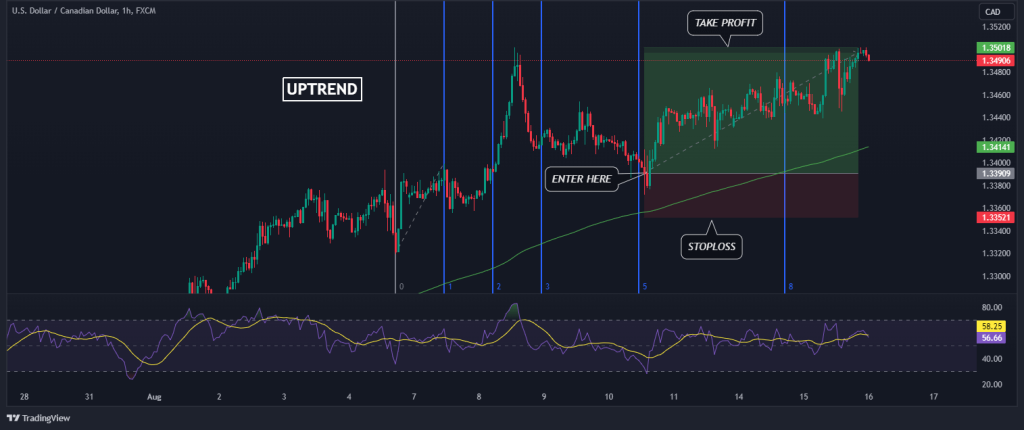
5. Execute Your Trade
Once all your criteria align, enter your trade around the Fibonacci Time Zone line with a clear stop-loss and take-profit strategy in place.
How to Use Fibonacci Time Zones for Exit Levels
Fibonacci Time Zones can also be valuable for determining when to exit a trade. Here’s how you can use them for exit strategies:
1. Plot Fibonacci Time Zones
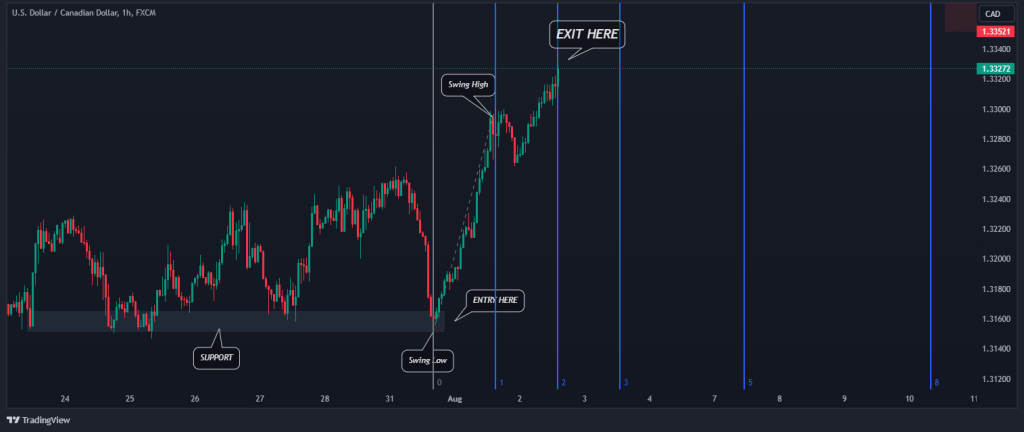
Let’s assume you took your buy entry right at the bottom of the swing low in a bullish trend. The price is going in your favor, and everything is looking good. It’s time for an exit, you think. So, you draw the Fibonacci Time Zones from the swing low to the closest swing high to your trade entry point.
The chart above, for instance, assumes you caught the big bullish move on the USDCAD forex pair right at the established support level. Once you get a swing high, you draw your Fibonacci Time Zone indicator from the swing low to the swing high.
2. Monitor Price Movements
As the trade progresses, closely monitor the price in relation to the Fibonacci Time Zones. When the price approaches a significant time zone, it may be an indication to start considering an exit. You can either choose to exit your position here or wait for more confirmation.
3. Use Confluences
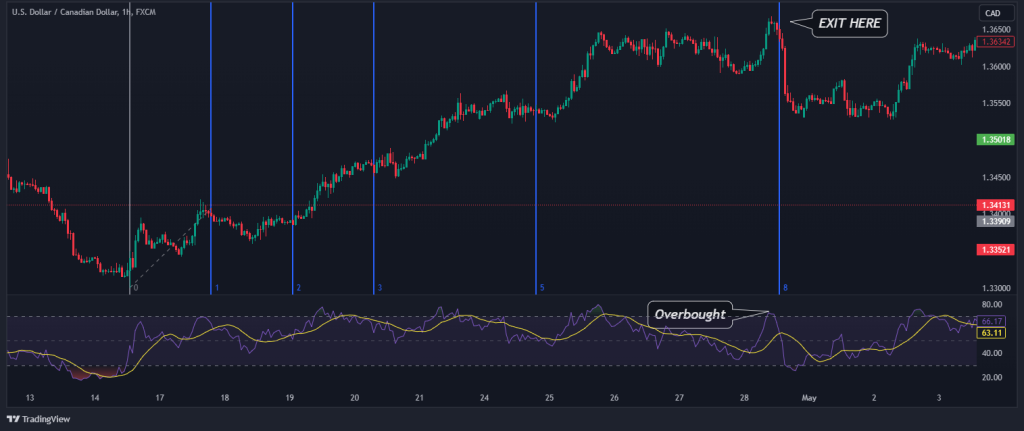
To maximize profit and avoid taking profits too early, consider using an indicator like the RSI as a confluence. So, let’s use another example. Here, we entered a short-sell trade. In that case, you should consider getting out of a SELL trade when the price hits a Fibonacci time zone while RSI is oversold.
Conversely, exit a BUY trade when the RSI is overbought and the price is at a Fibonacci time zone. The image below is a perfect example of how you can exit a buy trade using the RSI overbought/oversold as confluence.
How To Improve Your Fibonacci Time Zone Trading Strategy
Now that we’ve covered the basics of Fibonacci Time Zones for entry and exit levels, let’s dive deeper into some advanced techniques to refine your trading strategy:
1. Add More Fibonacci Time Zones
While the Fibonacci sequence typically uses specific numbers, don’t hesitate to experiment with additional Fibonacci Time Zones. In addition to the common 1, 2, 3, 5, 8, 13, and 21 intervals, you can include 34, 55, and 89. The more time zones you have, the better your chances of identifying significant reversal points. This can be adjusted in the indicator’s settings on your chosen trading platform.
2. Use Time Zone Clusters
Look for clusters of Fibonacci Time Zones that align with other technical indicators or chart patterns. When multiple time zones with different origins converge, they strengthen the potential reversal or continuation signal. This convergence, known as the “Fibonacci clusters,” can be a powerful confirmation of your trading decisions.

3. Market Hours Consideration
Take into account the market’s trading hours when using Fibonacci Time Zones. Different assets exhibit varying levels of volatility during specific sessions.
For example, USD pairs in the forex market typically experience reversals during the New York / London Close ICT Kill Zones. If you’re looking to catch this reversal, your conviction gets stronger if your reversal signal coincides with a Fibonacci time zone during this session. That is a key point in using the Fibonacci Time Zone indicator – that is, following market hours when the price might retrace or continue trending in the same direction.
Wrapping Up
Fibonacci retracements are one of the most popular tools in the industry today. However, for some reason, not many are familiar with its younger sibling, the Fibonacci Time zones. The underlying principle, the Fibonacci sequence, doesn’t just apply to price alone – it also applies to time! And that is why the Fibonacci Time Zone can be such a valuable tool in analyzing the market and predicting future price movements.
Frequently Asked Questions About Fibonacci Time Zones
Find answers to some of the most frequently asked questions about the Fibonacci time zone tool here:
Can Fibonacci Time Zones be used on all timeframes?
Yes, Fibonacci Time Zones can be applied to various timeframes, from intraday trading to long-term investing. The choice of timeframe depends on your trading style and strategy.
How do I determine the starting point for Fibonacci Time Zones?
The starting point is usually the most recent significant high or low in the price, depending on whether you’re in an uptrend or downtrend.
Can Fibonacci Time Zones be used in conjunction with other Fibonacci tools?
Absolutely. Many traders use Fibonacci Time Zones alongside other Fibonacci tools like retracement and extension levels to create a comprehensive trading strategy. Note, however, that the display of the two indicators can be quite confusing since one is horizontal and the other is vertical. Therefore, it’s better to use the multiple timeframe analysis techniques to be able to use these various Fibonacci tools.
Is it necessary to manually draw Fibonacci Time Zones on a chart?
While manual drawing is common, some trading platforms offer automated Fibonacci Time Zones tools that can save time and improve accuracy.
Risk Disclosure: The information provided in this article is not intended to give financial advice, recommend investments, guarantee profits, or shield you from losses. Our content is only for informational purposes and to help you understand the risks and complexity of these markets by providing objective analysis. Before trading, carefully consider your experience, financial goals, and risk tolerance. Trading involves significant potential for financial loss and isn't suitable for everyone.