


- Fibonacci in trading is based on a mathematical sequence and the golden ratio, providing valuable insights into financial markets.
- Key Fibonacci tools, including retracement, expansion, fan, and channel, help traders identify support and resistance levels.
- Different Fibonacci trading tools, such as retracements, time zones, fans, and arcs, provide various ways to analyze and predict market movements.
- While Fibonacci can be a powerful trading strategy, it’s essential to backtest, use risk management, and consider it as part of a comprehensive trading approach.
If you’re familiar with the world of trading, you’ve likely come across the term “Fibonacci” at some point. But what exactly is Fibonacci in trading, and why is it considered such a powerful tool for traders?
In this article, we will introduce the concept of the Fibonacci trading strategy, starting from defining what the Fibonacci trading strategy is to showing you how to trade with it.
What is Fibonacci in Trading?
Fibonacci, in the context of trading, is a mathematical concept that finds its roots in the famous Fibonacci series. This series, which begins with 0 and 1, continues by adding the last two numbers to get the next one, creating a Fibonacci sequence that goes like this: 0, 1, 1, 2, 3, 5, 8, 13, 21, 34, and so on. It was originally discovered by Leonardo Fibonacci, an Italian mathematician, in the 13th century.
Now, you might be wondering, what does this seemingly abstract mathematical sequence have to do with financial markets and trading? The answer lies in the fascinating connection between Fibonacci numbers and the golden ratio, which is approximately 1.618. In trading, this relationship with the golden Fibonacci ratio becomes incredibly useful because it’s found that financial instrument price trends have a special connection with Fibonacci numbers.
Therefore, traders utilize various Fibonacci tools, including retracement, expansion, fan, and channel. These tools are not your typical lagging indicators; they lead the price. This means that traders can anticipate market movements and effectively plan their trades using Fibonacci, making it an invaluable ally in the trader’s toolkit.
One of the key applications of Fibonacci in trading is to identify support and resistance levels on a price chart. These Fibonacci levels play a crucial role in helping traders make informed decisions about when to open or close positions, as well as where to place stops and limits.
In sum, Fibonacci is a key aspect of trading. Furthermore, since Fibonacci is used by many people worldwide, these numbers become very important when it comes to predicting where prices may pause and where traders can enter and exit positions. You can also find many Fibonacci calculators online and Fibonacci pivot points tools.
How to Draw Fibonacci Retracement Levels
The Fibonacci retracement tool is perhaps the most popular of the Fibonacci family. Due to its ease of use and effectiveness, you would have seen many traders adopting it in their trading plans. So, here’s the question that you may be having on your mind right now: how can I draw the Fibonacci retracement levels?
The answer is quite straightforward.
One important thing to remember while using this Fibonacci tool is that it is a trend-following tool. In a way, it’s useless trying to use the Fibonacci retracement tool when you are not sure of the prevailing trend. As such, to effectively use the Fibonacci tool, you must first identify the market trend.
So, here’s how it works:
Drawing Fibonacci Retracement Level in an Uptrend
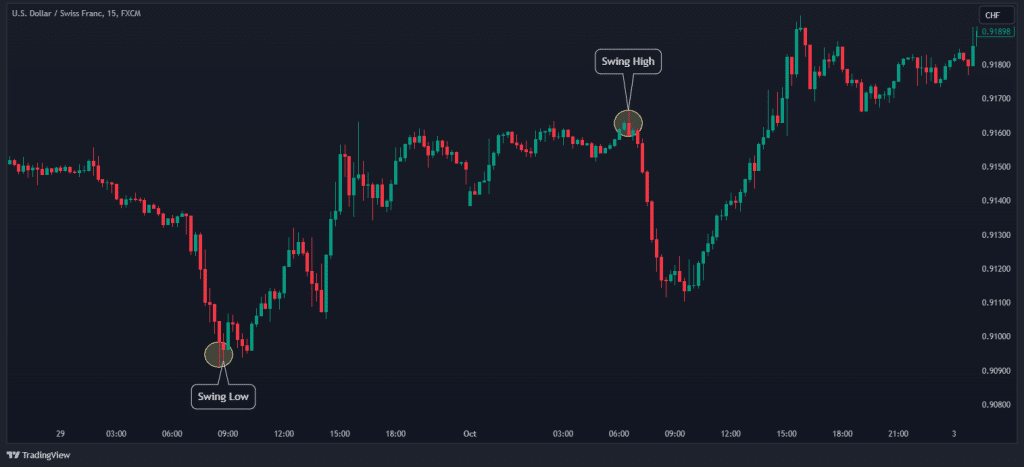
In an uptrend, we expect prices to continue moving upward, forming a series of higher highs and higher lows until the trend is broken. To predict where the next higher low will be formed, we simply have to start by marking out the swing high and the swing low closest to the price, as shown in the chart below.
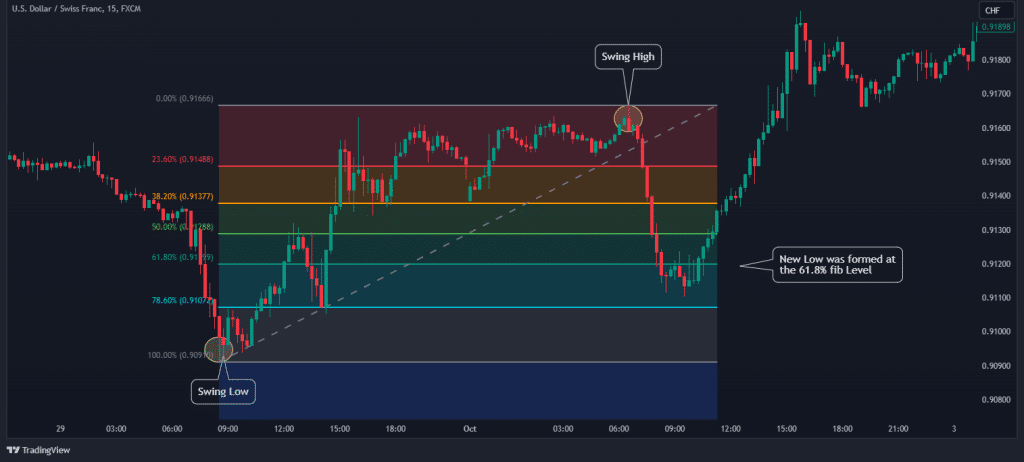
Next, after identifying our swing highs and swing lows, all we need to do is draw our Fibonacci retracement tool from the swing low to the swing high, as shown below. Once done, we can wait for the price to form a new low in any of the valuable Fibonacci retracement levels.
Drawing Fibonacci Retracement Level in a Downtrend
In a downtrend, the logic works the same. The formation of lower highs and lower lows characterizes a downtrend. We will, therefore, be using this tool to predict where the next lower high will be formed before the price goes lower.
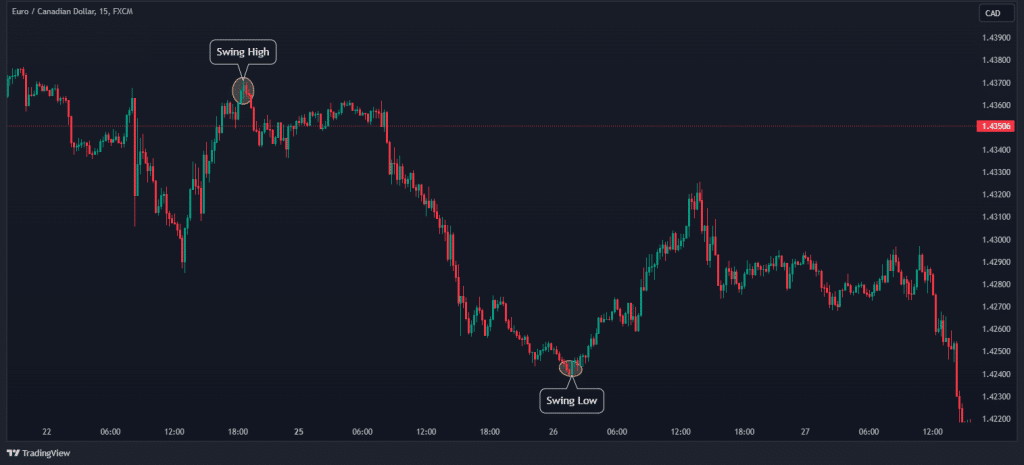
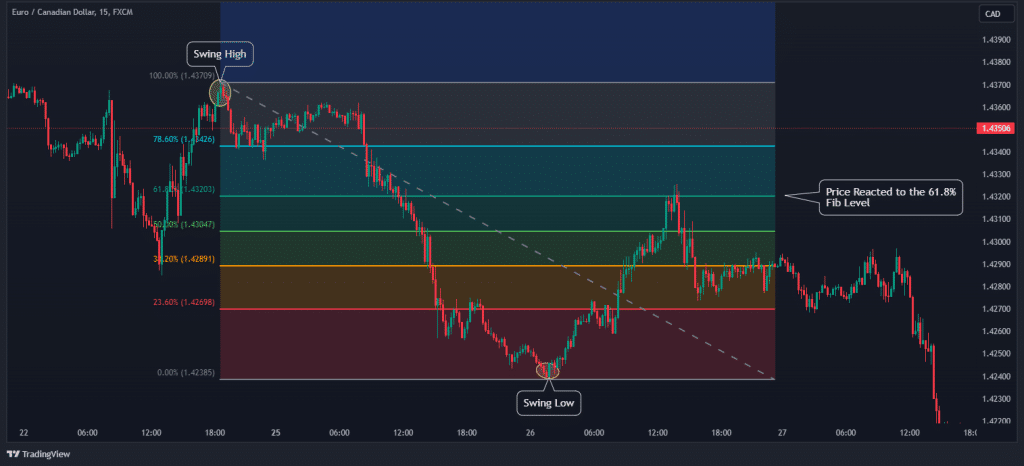
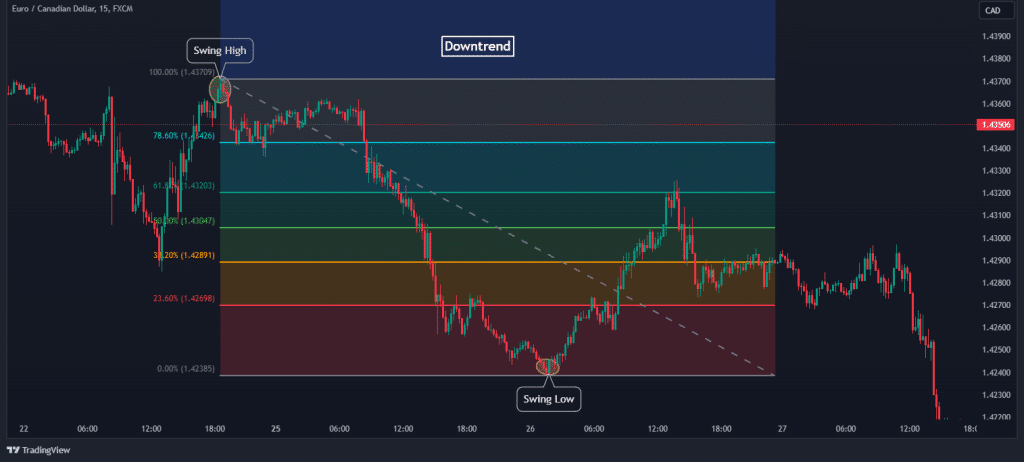
The first step is to identify significant swing highs and swing lows that are closest to the current price, as shown in the chart below.
These swing points provide us with the range from where we expect the price to form our new lower high. To predict this level, simply draw the retracement tool from the swing high to the swing low and expect the next lower high to be formed at any of the valuable retracement levels, as shown in the chart below.
Note: Using this tool is straightforward; however, people often make mistakes while applying them to their chart. Remember this: always draw the Fibonacci retracement tool from swing low to swing high while in an uptrend. Conversely, only draw the retracement levels from swing high to swing low in a downtrend.
Different Types of Fibonacci Tools
In Fibonacci trading, various tools play a pivotal role in analyzing charts and predicting market movements. While Fibonacci retracements are widely known as the most popular Fibonacci tools, there are other Fibonacci tools you should be aware of. So, let’s dive into the different types of Fibonacci tools that traders use to navigate the financial markets.
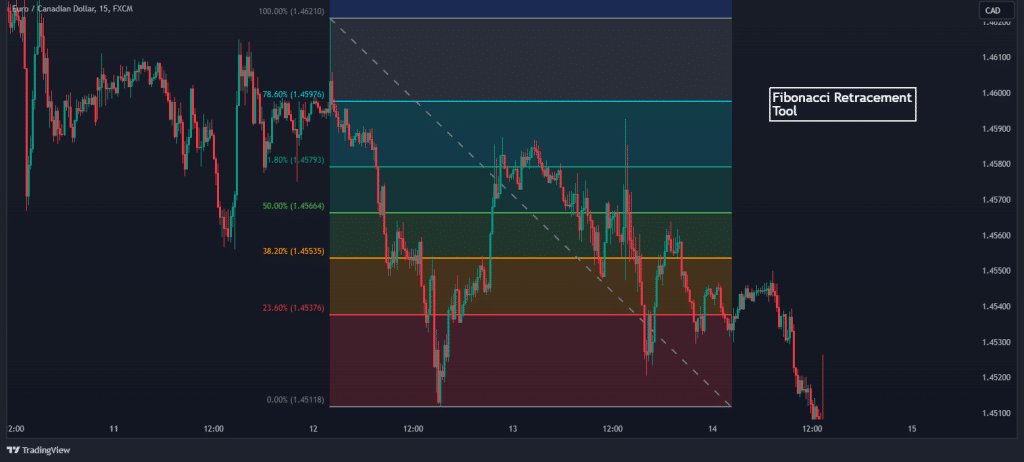
Fibonacci Retracements
Fibonacci retracements are crafted from the high and low points on a stock chart. These price levels are divided by key Fibonacci ratios, including 23.6%, 38.2%, 50%, 61.8%, and 100%. The result is a set of horizontal lines that act as signposts for traders. These lines help traders identify potential support and resistance areas on the chart.
When the price approaches these lines, it often signals a potential trend reversal, resistance, or support. The 61.8% retracement level, in particular, holds a significant role in indicating potential trend reversals.
It’s at this point that new support and resistance levels tend to cluster, making this level a valuable resource for traders. So, Fibonacci retracements not only provide insights into potential reversals but also highlight key price levels that traders closely monitor.
Fibonacci Time Zones
Fibonacci time zones identify periods of significant price movement. Traders draw vertical lines at Fibonacci intervals (0, 1, 2, 5, 8, 13, and so forth) on a chart. These lines help predict potential trend continuations or reversals. What’s fascinating about Fibonacci time zones is that they are price-independent. It means they can be applied to various financial instruments without being influenced by the price.
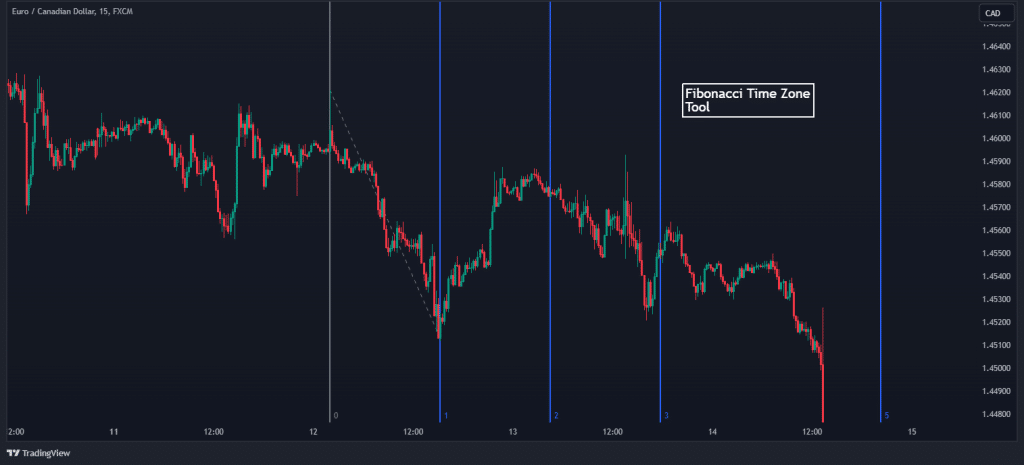
The beginning of a new time zone often serves as a potential hotspot for market movement. As traders know, history often rhymes in the financial markets, and these time zones help predict potential trend continuations or reversals. They provide traders with an invaluable tool for keeping an eye on the clock, as well as the charts.
Fibonacci Fans
Fibonacci fans are a bit different in that they utilize three trend lines based on Fibonacci retracement levels. These lines are essential for measuring the speed of a trend’s movement, whether it’s an uptrend or a downtrend. They are created by dividing the vertical distance between two points by key Fibonacci ratios.
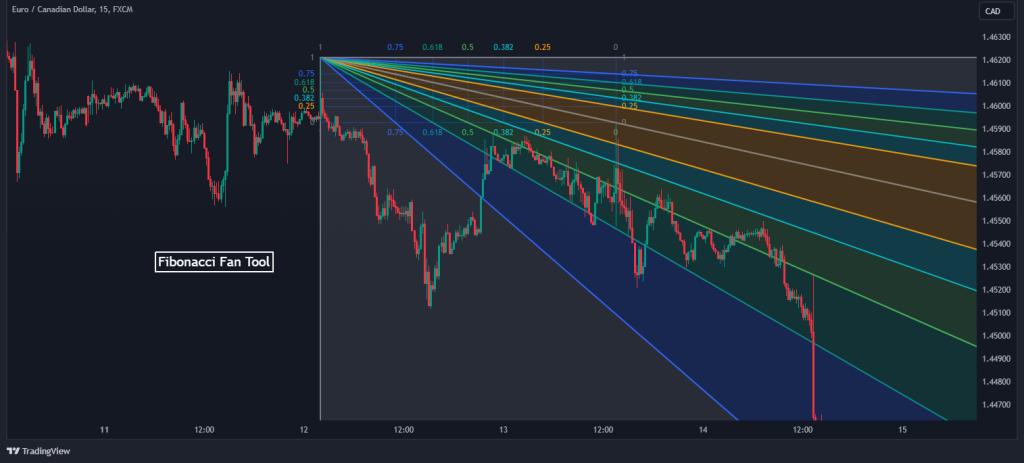
The concept behind Fibonacci fans is that price tends to retrace before continuing in its trend. If the price dips below a Fibonacci fan trendline, it often indicates a further decline in the price. Therefore, the Fibonacci fan is primarily known as a continuation indicator.
Fibonacci Arcs
The final tool in the Fibonacci trader’s arsenal is the Fibonacci arcs. These arcs introduce three curved lines based on Fibonacci retracement points. What’s unique about Fibonacci arcs is their ability to help traders anticipate key support and resistance levels. Traders draw curves that intersect a trendline at specific Fibonacci ratios, creating a visual representation of potential price levels.
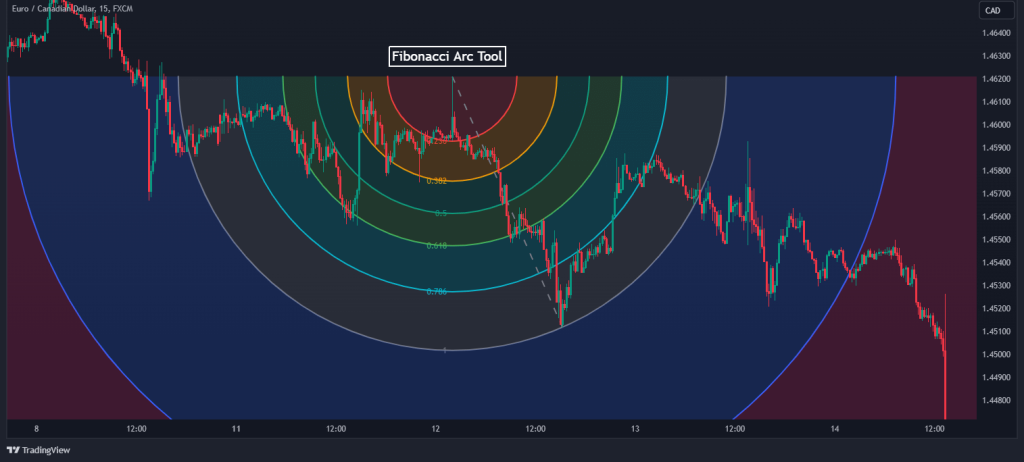
When the price crosses through these key levels, it signifies potential trading opportunities that traders can leverage to their advantage. The curvature of these arcs allows traders to visualize the potential trajectory of price movements. It’s a powerful tool for spotting potential turning points in the market.
Fibonacci Trading Strategy – How to Trade with Fibonacci
So far, we have covered the most important aspects of the Fibonacci trading strategy. Now, we will be putting everything together to see how you can trade this strategy on the chart.
Just before we get to it, knowing what style of trading fits your personality is crucial to knowing how to use this concept in your overall trading plan. In our Fibonacci trade example, we will tailor the examples here to naked chart traders and indicator-based traders.
Naked Chart Fibonacci Trading Strategy
Many traders don’t feel comfortable trading with any indicator on their chart, as they could feel distracted and overwhelmed with the amount of data those indicators could be sending their way. Still, those traders often use the Fibonacci tool, and here’s where the Fibonacci retracement tool can step in.
The Fibonacci retracement tool is effective when used alone with a clear understanding of the prevailing trend. Just as we have shown when describing how to set up the Fibonacci retracement tool on your chart, all you need to do is identify the trend and draw the Fibonacci retracement tool on the chart, as shown on the chart below.
Since we don’t know which level the price will retrace to precisely, we need to confirm our entry using candlestick patterns. We will focus on the Doji candle and the Engulfing candlestick patterns.
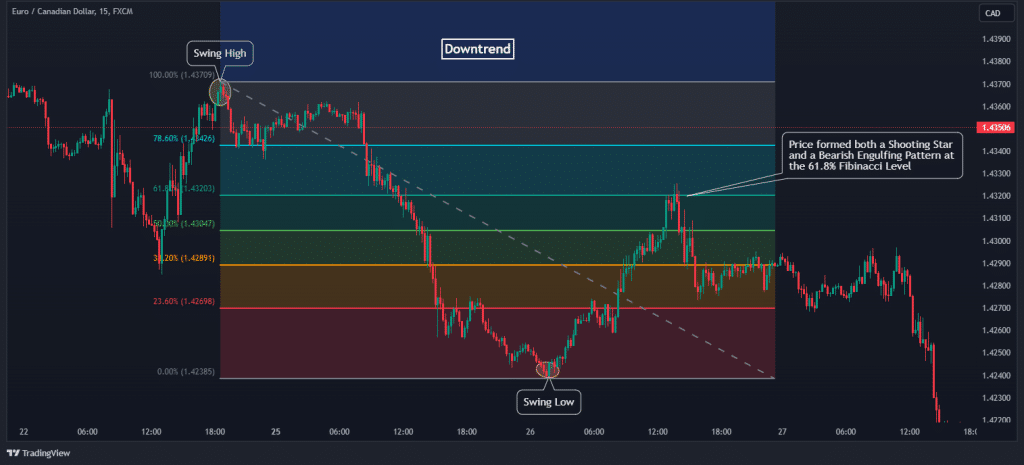
From the Eur/CAD chart above, you can see that we were in a downtrend; the price retraced to the 50% Fibonacci retracement level and gave us the expected candlestick pattern, that is, the shooting star candle pattern; we can now open a short-sell position here.
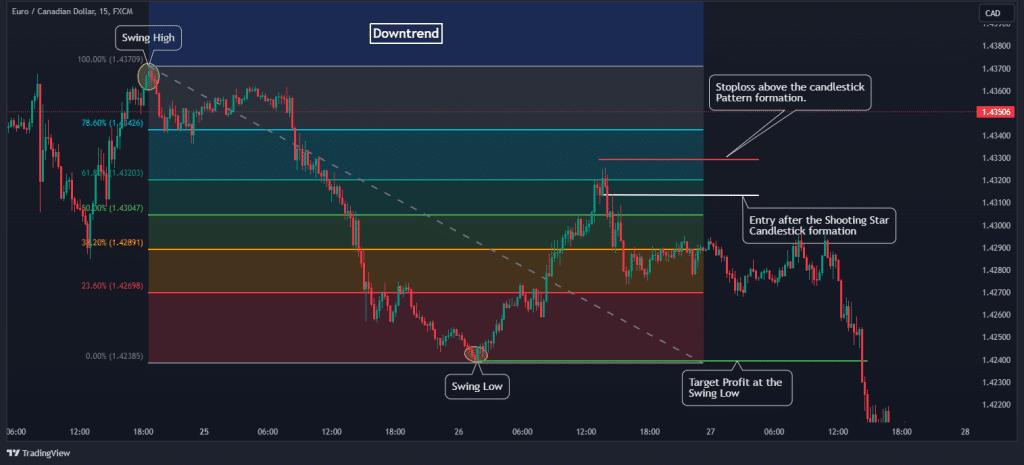
Once in the trade, the most important thing is to set our stop loss and target profit. This should be the easiest part of this strategy since the Fibonacci retracement can help in identifying stop loss and take profit levels. Simply put the stop loss below the candlestick formation and set the target profit at the swing high.
MACD and Fibonacci Retracement Trading Strategy
Having an extra layer of confirmation can dramatically improve the win rate of most Fibonacci trading strategies. Using the Moving Average Convergence Divergence (MACD) with the Fibonacci retracement tool is not an exception. With this strategy, you will avoid taking a lot of potentially losing trade. Here’s how it works:
After determining the trend, simply plot your Fibonacci retracement tool, as shown in the chart below.
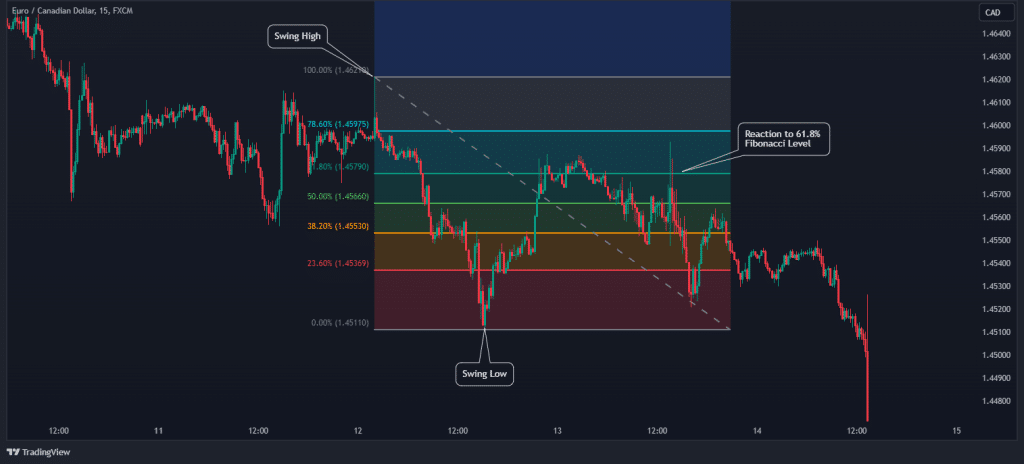
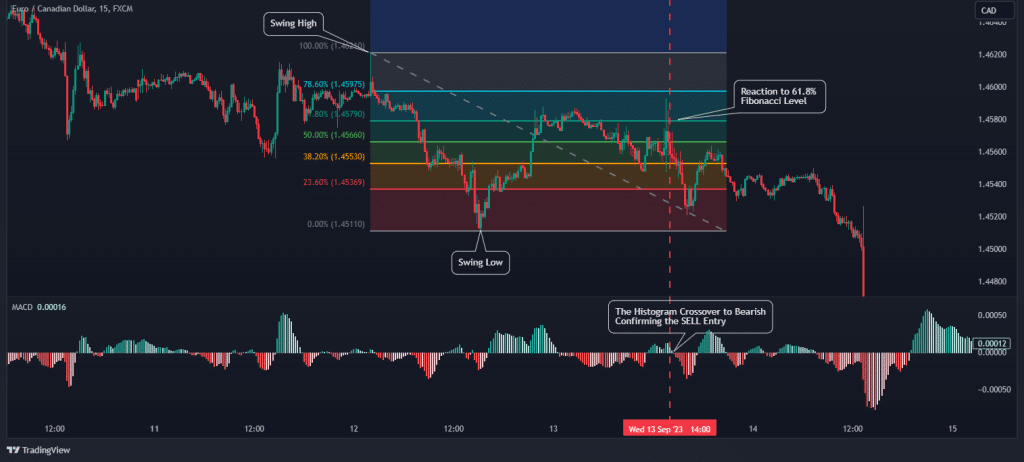
All we have to do is wait for the price to retrace to any of the valuable retracement levels and continue the trend from there. In this case, the price retraced to the 61.8% level. It is at this point that we check the MACD for confirmation. The histogram also confirms that the price is ready to continue the trend. We can then enter a sell trade here.
After this trade, setting our stop loss levels and target profit is similar to the first strategy. In an uptrend, all you have to do is place your stop loss below the swing point closest to the entry point and set your target profit to the 100% Fibonacci retracement level.
Over To You
To sum it up, some traders might be a bit skeptical about this math-based trading strategy. They see it as more of a self-fulfilling prophecy because so many people are using it rather than something with mystical powers. However, even for the doubters, the Fibonacci trading tool can give you a better perspective on potential market turning points that might not be immediately clear.
So, here’s the deal: before you risk your hard-earned money, make sure to backtest this strategy extensively and practice it on a demo account. Remember, even the best trading strategies can hit a rough patch. When that happens, it’s all about how you manage your risk that sets you apart as a successful trader.
Frequently Asked Questions About the Fibonacci Trading Strategy
Here are some popular questions on Fibonacci trading.
Is Fibonacci a good trading strategy?
Yes, Fibonacci can certainly be an effective trading strategy. It’s based on mathematical principles that help traders identify potential support and resistance levels, trend reversals, and market movements. However, it’s essential to use Fibonacci tools in conjunction with other trading strategies and analysis for a comprehensive approach.
What is the best time frame for the Fibonacci strategy?
The best time frame for the Fibonacci strategy can vary depending on your trading goals. Shorter time frames, like 15 minutes or 1 hour, are suitable for day trading and scalping, while longer time frames, like daily or weekly, can be used for swing or position trading. Nonetheless, in any trading strategy you choose, it’s advisable to use the multiple timeframe analysis method.
What is the strongest Fibonacci level?
The 61.8% Fibonacci level is often considered one of the strongest. It’s known as the “Golden Ratio” and frequently indicates potential trend reversals and significant support or resistance areas. However, other key levels, like 38.2% and 50%, also play crucial roles in Fibonacci analysis.
Why do traders use Fibonacci?
Traders use Fibonacci because it provides valuable insights into price movements and helps them make informed trading decisions. Fibonacci tools assist in identifying potential entry and exit points, managing risk, and understanding market psychology. It adds a quantitative and mathematical dimension to trading analysis, which can be highly beneficial in navigating the financial markets.
Risk Disclosure: The information provided in this article is not intended to give financial advice, recommend investments, guarantee profits, or shield you from losses. Our content is only for informational purposes and to help you understand the risks and complexity of these markets by providing objective analysis. Before trading, carefully consider your experience, financial goals, and risk tolerance. Trading involves significant potential for financial loss and isn't suitable for everyone.


