


The TRIX indicator measures the rate of change in a triple exponential moving average to identify potential trends and reversals in financial markets. Traders and investors can use it to assess the strength of price momentum and identify potential buying or selling opportunities.
- The TRIX indicator is a potent tool used to detect overbought and oversold market conditions while also functioning as a momentum indicator.
- TRIX filters out insignificant price movements.
- TRIX provides smoother outputs than the MACD because of the triple smoothing of the exponential moving average (EMA) used in its calculations.
This guide will explore the intricacies of the Triple Exponential Average (TRIX) indicator, its calculation method, and how it can be effectively utilized in technical analysis to enhance trading decisions.
- What is the Triple Exponential Average (TRIX) Indicator and How Does It Work?
- How to Use the TRIX Indicator in Trading
- Triple Exponential Average Indicator Trading Strategy Tutorial
- TRIX Indicator – Pros and Cons
- What are the Best Settings for the TRIX Indicator?
- What is the Difference Between TRIX and EMA?
- Key Takeaways
What is the Triple Exponential Average (TRIX) Indicator, and How Does It Work?
Developed by Jack Hutson in the early 1980s, the Triple Exponential Average (TRIX) indicator has gained popularity among technical analysts for its ability to identify divergences and provide directional cues. It is a powerful tool used in trading to identify oversold and overbought market conditions while also serving as a momentum indicator.
TRIX filters out insignificant price movements by applying a triple smoothing technique to moving averages, providing traders with a clearer picture of market trends. It is typically displayed as a sub-chart, appearing below the main chart. This placement allows traders to quickly reference the TRIX values while analyzing price movements on the main chart.
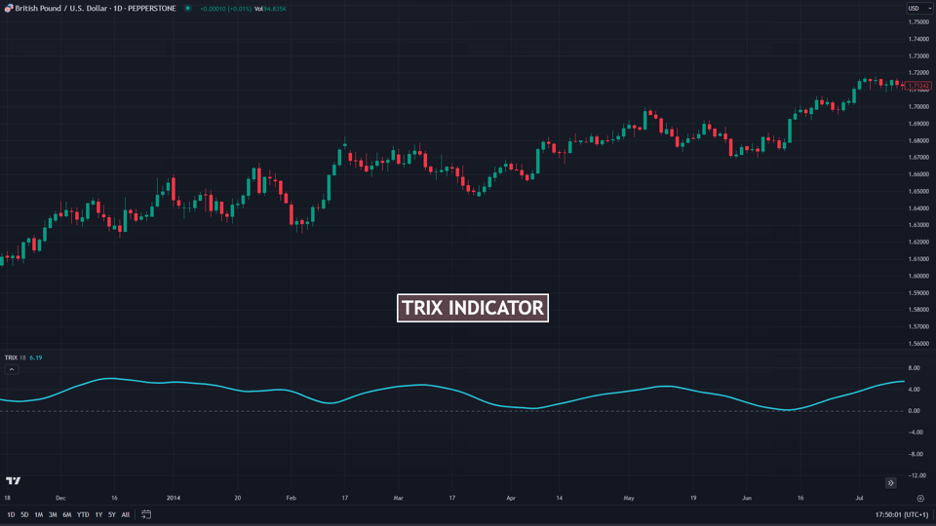
Technically, the indicator consists of two TRIX lines that plot the values derived from the triple exponential moving average. The indicator settings can be adjusted to suit individual preferences and trading styles, but traders commonly use the default settings of 15 for the triple-smoothed EMA and 9 for the TRIX signal line.
It’s worth noting that the TRIX indicator shares similarities with the Moving Average Convergence Divergence (MACD) indicator. However, when comparing Trix Vs. MACD, the primary distinction lies in the smoothing of the output. TRIX outputs are smoother due to the triple smoothing of the exponential moving average (EMA) used in its calculations.
The TRIX indicator is calculated by applying a series of exponential moving averages (EMA) to the closing price. First, an EMA is calculated using the closing price. Then, another EMA is applied to the previous EMA value, and this process is repeated one more time. The final result is obtained by subtracting yesterday’s (or any applied timeframe) triple EMA value from today’s triple EMA value and dividing it by yesterday’s triple EMA value.
This calculation helps determine the rate of change in the TRIX indicator, providing insights into price momentum. In short, the Trix Indicator formula is given by:
EMA1 = EMA( Close )
EMA2 = EMA( EMA1 )
EMA3 = EMA( EMA2 )
TRIX = ( EMA3 [today] – EMA3 [yesterday] ) / EMA3 [yesterday]
Where:
EMA – Exponential Moving Average
Understanding the values generated by the indicator is crucial for effective trading. But overall, what you need to remember is that when the TRIX signal line crosses above the zero line, it is considered a buy signal, indicating a potential uptrend in the market. Conversely, when the TRIX line closes below the zero line, it is viewed as a sell signal, indicating a potential downtrend.
How to Use the TRIX Indicator in Trading
Utilizing the TRIX indicator on a trading platform can provide valuable insights into market trends and potential trading opportunities. To use the indicator, you must first add it to your trading platform.
Adding the TRIX indicator to your chart on popular platforms like TradingView or MetaTrader4 is a straightforward process that can enhance your technical analysis toolkit.
To add the TRIX indicator to your chart on TradingView, follow these steps:
- Open the TradingView platform and select the desired trading pair or asset.
- Click on the “Indicators” button at the chart window’s top.
- In the search bar, type “TRIX” and select the indicator from the list of options.
- Adjust the indicator’s parameters according to your trading preferences, or use the default settings.
- Once configured, click the “Apply” button to add the indicator to your chart.

Once you have successfully added the indicator to your chart, understanding its use cases is crucial for effective trading. Here are a few common scenarios where the TRIX indicator can be useful:
Zero Crossover
The TRIX indicator helps assess the market’s momentum. With the centerline value of 0, significant turning points can be found as the TRIX line crosses above and below the zero line, suggesting a shift in market sentiment.
A TRIX crossover from below to above indicates a strengthening impulse in the market, indicating potential buying opportunities for traders. Conversely, a crossover of the centerline from above shows a weakening impulse, signaling potential selling opportunities in the market (as you can see in the GBP/USD chart below).

So, to TRIX zero crossover strategy:
- Sell when the TRIX crosses your zero line to the downside.
- Buy when the TRIX crosses your zero line to the upside.
Divergences
Like any other indicator, divergences occur when the TRIX indicator’s direction contradicts the price action. When trading divergence, traders are looking for bullish and bearish divergences.
A bullish divergence occurs when the price forms lower lows while the TRIX indicator forms higher lows, indicating a potential bullish reversal. It is also considered a bullish divergence when the TRIX indicator makes a higher high while the price forms a lower high.
Bearish divergence, on the other hand, occurs when the price forms higher highs while the TRIX indicator forms lower highs, suggesting a potential bearish reversal. Similarly, it is also a bearish divergence when the price forms higher lows while the TRIX forms lower lows.

Triple Exponential Average Indicator Trading Strategy Tutorial
We can develop effective trading strategies that give us valuable insights into potential entry and exit points by focusing on the zero crossovers in combination with other indicators. Here are two of the most effective strategies to use with the TRIX indicator:
Use TRIX and a Moving Average Indicator
To find a trade using the TRIX indicator, we can combine it with an exponential moving average indicator for confirmation. Here’s a step-by-step guide:
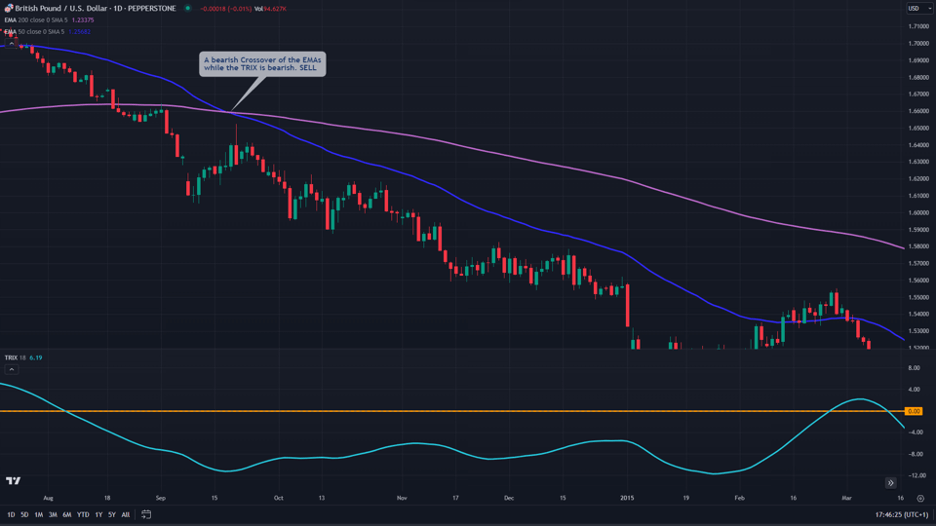
Sell Signal
When the 50 EMA crosses below the 200 EMA while the TRIX indicator is below the zero line, it presents a compelling sell setup. This confluence of signals suggests a strong bearish bias in the market.
Buy Signal
On the other hand, when the 50 EMA crosses above the 200 EMA with the TRIX indicator above the zero line, it indicates a potential buy setup, signaling a bullish bias.

Note that for each setup, it doesn’t matter which happens first or last. You should make the appropriate trade when the EMAs confirm the TRIX or vice versa. Your stop losses should be below the longer EMA line in bearish trades but above the longer EMA line in bullish trades.
Add Fibonacci Retracement Levels
Another effective strategy involves combining the TRIX indicator with Fibonacci retracement levels. Here’s how to execute this strategy:
- Identify a financial asset with a clear TRIX crossover above or below the zero line, which indicates the trend bias. For example, a crossover above the zero line suggests a bullish trend, while a crossover below suggests a downtrend.
- In a bullish trend, plot the Fibonacci retracement tool from the most recent swing low to the swing high and wait for the price to retrace to the 0.382, 0.5, or 0.618 Fibonacci level. This retracement zone becomes a potential buying opportunity.
- Place the stop loss below the Fibonacci level, where the price reacts. Similarly, in a downtrend, look for price retracements to the 0.382, 0.5, or 0.618 Fibonacci level as potential selling opportunities. Place the stop loss above the active Fibonacci level.

TRIX Indicator – Pros and Cons
The TRIX indicator is a valuable tool in trading. However, like any technical indicator, it has its pros and cons. Here are the ones to take note of:
Benefits of Using the TRIX Indicator
The TRIX indicator effectively smooths price data by utilizing a triple exponential moving average (EMA) calculation. This smoothing capability helps eliminate market noise and provides a clearer picture of the underlying trend, making it easier to identify significant price movements and potential trade setups.
Additionally, the indicator is renowned for its proficiency in detecting early trend reversals. Its unique formula often generates signals ahead of other oscillators, giving traders an opportunity to capture potential trend changes at an early stage.
Pros
- Smoothed representation
- The TRIX indicator helps traders identify shifts in momentum
- The TRIX indicator can be effectively used in conjunction with other technical indicators, such as moving averages or Fibonacci retracement levels, to enhance the accuracy of trading signals
Limitations of the TRIX Indicator
Despite its strengths, the TRIX indicator has certain limitations that traders should be aware of. One of the main drawbacks is that it is a lagging indicator. Like many technical analysis tools, there is a delay between the occurrence of a price movement and the TRIX indicator reflecting that change.
Furthermore, the performance of the TRIX indicator can be influenced by the prevailing market conditions. During periods of low volatility or choppy price action, the TRIX indicator may generate more false signals or fail to provide clear indications.
Cons
- Lagging nature
- May generate false signals
- The effectiveness of the TRIX indicator can vary from chosen parameters
What are the Best Settings for the TRIX Indicator?
The best settings for the TRIX indicator may vary depending on the trader’s preferences and the specific financial asset being analyzed. However, a common practice is to use a 14-period TRIX indicator. The TRIX indicator that comes with the TradingView charting software has a default setting of an 18-period. These settings are often considered a good starting point, but it’s essential to adjust them based on your trading style, timeframes, and the market conditions you observe.
If you want something more sensitive to price movements for day trading, you can drop to the 8-12 period range. However, if you want something that suits swing trading, the 18-period and anything higher should work just as well.
What is the Difference Between TRIX and EMA?
The Exponential Moving Average (EMA) and the Triple Exponential Average (TRIX) are both derived from moving averages, but they serve different purposes in technical analysis. The EMA is a trend-following indicator that smooths price data by giving more weight to recent prices. This makes it responsive to current price changes, and it’s commonly used to identify trend direction, spot dynamic support or resistance zones, and generate crossover signals (like when a shorter EMA crosses a longer one).
On the other hand, TRIX is a momentum oscillator that uses a triple-smoothed EMA and then calculates its rate of change. This approach removes minor price fluctuations and focuses on longer-term momentum trends. The TRIX line oscillates around a zero level, where crossovers above or below zero often signal shifts in momentum. Traders also use divergence between TRIX and price to anticipate potential reversals.
While the EMA reacts more quickly to price changes and is used primarily for identifying trends and timing entries, the TRIX is slower due to its triple smoothing and is better suited for filtering out noise and confirming the strength behind a move. This makes TRIX especially useful in preventing false signals during volatile periods, whereas EMA can be more responsive in fast-moving markets.
In practice, traders often use these indicators together. The EMA helps define the trend direction, while the TRIX confirms whether that trend has enough momentum to sustain itself. This combined approach can improve trade timing and reduce the chances of entering on weak or fading moves.
Key Takeaways
- The triple exponential average (TRIX) indicator is a powerful tool used in trading to identify oversold and overbought markets while also serving as a momentum indicator.
- The TRIX line crossing above the zero line is a buy signal, suggesting a potential uptrend. Conversely, when the TRIX line closes below the zero line, it is a sell signal, indicating a potential downtrend.
- For best results, the TRIX indicator should be used in combination with other indicators such as Fibonacci retracement levels, RSI, and MACD.
- While both TRIX and MACD are momentum indicators, the primary distinction lies in the smoothing of the output. TRIX outputs are smoother due to the triple smoothing of the exponential moving average (EMA) used in its calculations.
Risk Disclosure: The information provided in this article is not intended to give financial advice, recommend investments, guarantee profits, or shield you from losses. Our content is only for informational purposes and to help you understand the risks and complexity of these markets by providing objective analysis. Before trading, carefully consider your experience, financial goals, and risk tolerance. Trading involves significant potential for financial loss and isn't suitable for everyone.


