


Are you familiar with the long-legged Doji candlestick pattern? If not, read on to learn more about this powerful formation.
Traders view the long-legged Doji as a signal of market indecision. This article will teach you to identify, interpret, and trade the long-legged Doji chart pattern.
What is the Long-Legged Doji Pattern?
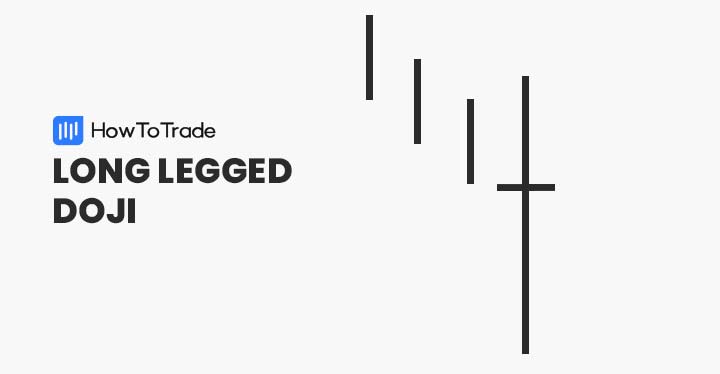
The long-legged Doji is a Japanese candlestick pattern that signals market indecision. It consists of a single candle with long wicks and exact or approximate opening and closing prices.
How to Identify the Long-Legged Doji in Trading?
Long-legged Doji candles are easy to recognize. Visually, they resemble a “+” with long upper and lower shadows. The GBP/USD chart below gives us a clear illustration of the long-legged Doji.

To trade the long-legged Doji candle, follow these steps:
- Identify the long-legged Doji with long wicks and similar open and close prices
- Note where the long-legged Doji forms within evolving price action
- Define market structure (trend, rotational)
- Decide on a bullish, bearish, or neutral bias
1. Opening and Closing Prices
The long-legged Doji formation is defined by having the same or similar opening and closing prices. Subsequently, the candle has a small or non-existent body. Due to this structure, the long-legged Doji is readily discernable on your candlestick chart.
2. Upper and Lower Shadows
Contrary to regular Dojis, the long-legged Doji has long upper and lower shadows. This characteristic suggests that heavy buying and selling occurred before a “neutral” periodic settlement.
3. Interpreting Long-Legged Doji Candles
Long-legged Dojis may be interpreted in a variety of ways. Many traders view the candle as a signal of a forthcoming consolidation or breakout. Others see long-legged Doji candlesticks as a bullish reversal pattern.
Ultimately, the meaning of the pattern depends on where the long-legged Doji appears within the context of a broader market structure. In that aspect, traders often use fundamental analysis to evaluate the market conditions and identify buying and selling opportunities.
How to Trade the Long-Legged Doji Candlestick?
One of the best things about trading single candlestick patterns is that the process is straightforward. The long-legged Doji candlestick is no different — determine a market entry point and locate stop losses and profit targets.
Step 1: Market Entry
Compared to other candlestick patterns, the long-legged Doji gives the trader freedom in determining market entry. There are several ways to enter the market for this type of candle:
- Bullish or bearish: If anticipating a directional move in price, one can buy above the high or sell below the low of the long-legged Doji. A buy opens a new bullish position; a sell opens a new bearish position.
- Neutral: If anticipating market consolidation, one can sell above the candle’s high and buy beneath the candle’s low.
Step 2: Stop Losses
As with any technical tool you are using, stop losses is one way to protect your trading account from unfortunate price breaks. With the long-legged Doji candlestick, the process is simple.
If buying above the pattern, a stop loss is located beneath the candle’s lower wick. If selling below the pattern, a stop loss is located above the candle’s upper wick. In the case of a consolidation, stop losses are placed above sells and below buys.
Step 3: Profit Targets
No matter which way you trade the long-legged Doji candlestick, profit targets are best aligned according to a viable risk vs. reward ratio. Common risk/rewards are 1:1, 1:2, 1:3, 1:4, and 1:5.
When anticipating breakouts, profit targets are placed above buys and beneath sells. If trading market consolidation, profit targets are set beneath buys and above sells. In either case, the long-legged price Doji is the reference point for profit target placement.
Trading Example
There are many ways to trade the long-legged Doji candlestick pattern in trading. The example below pertains to a bullish breakout in the GBP/USD.

The above trade was executed as follows:
- An uptrend in price was identified.
- The long-legged Doji candle was isolated.
- A buy order was placed above the candle at 1.3510.
- The stop loss was located beneath the candle’s lower wick at 1.3486.
- The profit target was set at 1.3534, adhering to a 1:1 risk vs. reward ratio.
- The profit target was hit, producing a 24-pip gain.
Doji Vs. the Long-Legged Doji
Although similar, there are a few critical differences between a standard Doji and the long-legged Doji. The GBP/USD chart below illustrates each.
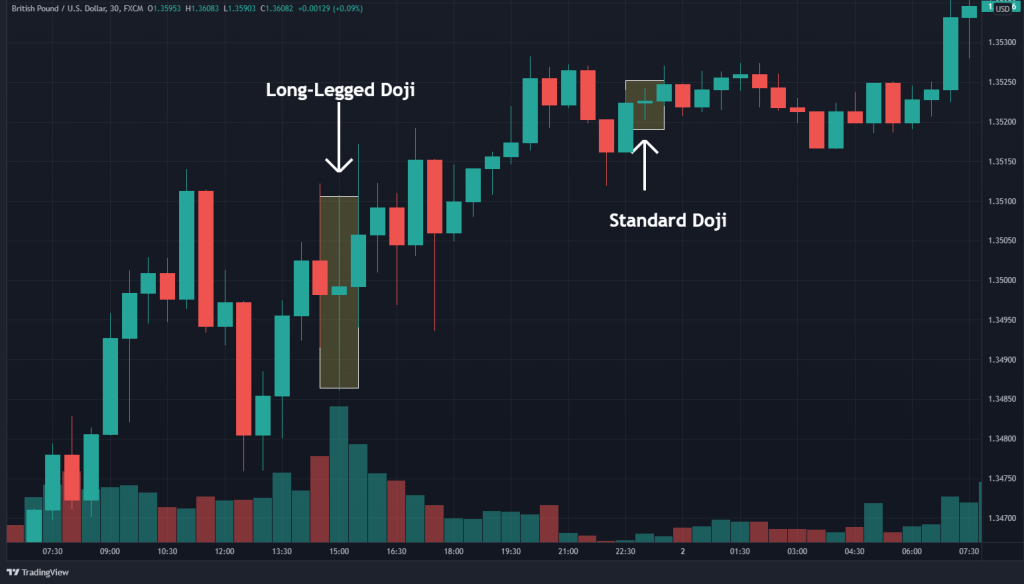
Here are the key differences:
- The regular Doji has symmetric upper and lower wicks.
- The long-legged Doji candlestick pattern has long upper and lower wicks.
- Long-legged Dojis signal intense buying and selling before a neutral settlement.
- A standard Doji suggests moderate volatility and “quiet” market conditions.
There are also other types of Doji candles such as the gravestone doji candle and the dragonfly doji candle.
The Long-Legged Doji Pattern — Pros and Cons
All candlestick patterns have a distinct array of pros and cons. The long-legged Doji candlestick pattern is no different.
Pros
- It may be found on all forex pairs, on all time frames
- Identifies trading opportunities in both trending and consolidating markets
- Works well in conjunction with other technical indicators
Cons
- Can produce false signals as the pattern often occurs in choppy market conditions
- Monthly, weekly, and daily long-legged Dojis frequently have large ranges, making them expensive to trade
- The pattern relies on a proper diagnosis of the market state to be traded effectively
Key Takeaways about the Long-legged Doji Pattern
These are the most common pros and cons of trading the long-legged Doji candlestick pattern:
- The long-legged Doji is a single-candle pattern. It consists of an elongated upper and lower wick with a small or non-existent body.
- Long-legged Doji candlesticks are a signal of market consolidation and indecision.
- The pattern may be used to trade bullish or bearish breakouts, reversals, or market consolidation.
- It’s up to the trader to decide which strategy is appropriate for the current market conditions.
Long-legged Doji Frequently Asked Questions
Below are a few frequently asked questions related to the long-legged Doji chart pattern.
Is the long-legged Doji 100% accurate?
No. No technical tool or chart pattern is infallible. Be sure to utilize prudent risk management when trading the formation.
Which is the best way to trade long-legged Dojis? Trend, reversal, or consolidation?
There is no “correct” way to trade the Doji. The pattern signals indecision and should be traded according to the trader’s read of the market.
Are consolidation trades less risky than breakout and reversal trades?
Yes. A consolidation trade’s risk vs. reward scenario is likely less than a breakout or reversal trade. Also, there are fewer false signals compared to the other strategies.
Risk Disclosure: The information provided in this article is not intended to give financial advice, recommend investments, guarantee profits, or shield you from losses. Our content is only for informational purposes and to help you understand the risks and complexity of these markets by providing objective analysis. Before trading, carefully consider your experience, financial goals, and risk tolerance. Trading involves significant potential for financial loss and isn't suitable for everyone.


