


Do you know there is a candlestick called, “yoi no myojyo doji bike minamijyuji set?” We are not making this up; that’s the Japanese name of the Doji Evening Star pattern – one of the many candlestick patterns that indicates a trend reversal.
- The Doji Evening Star is a bearish candlestick pattern often signaling a reversal in an uptrend.
- This pattern is characterized by a small-bodied candle between two long candles and indicates waning bullish momentum.
- It’s widely regarded by traders as a reliable predictor of potential downward movements in a bullish market.
This guide will discuss all there is to know about the Doji Evening Star pattern, including how to identify and trade it.
What is the Doji Evening Star Candlestick Chart Pattern?
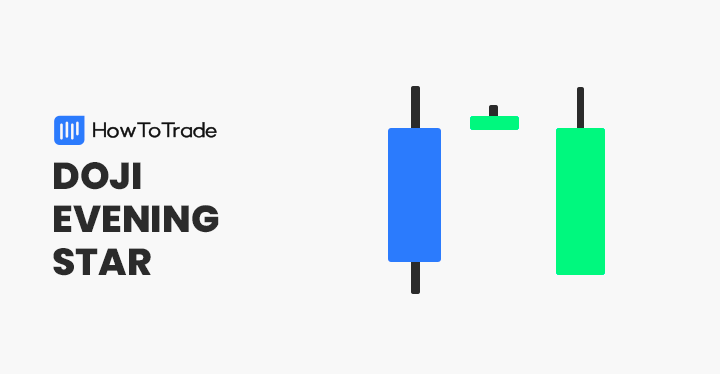
The Evening Doji Star pattern, which is the opposite version of the Doji Morning Star candlestick pattern, is a three-candle pattern that appears at the end of an uptrend and indicates that the existing is likely to end. It consists of three candles; a bullish first candle, followed by a Doji evening star, and finally, a bearish third candle. When the last candle appears, it signifies a change in trend.
Originally, Thomas Bulkowski presented the idea of the Doji Evening Star candle pattern in the Encyclopedia of the Candlestick Charts. The concept behind the Doji Evening Star is that buyers are losing control, and sellers are likely to push prices down.
Technically, many beginner traders need help differentiating between the traditional Doji and Evening Star Doji as they presume it is the same formation as the Doji candlestick. While they both have a similar construction, each presents a different signal. The traditional Doji is a single candlestick pattern that appears in an uptrend or downtrend to suggest market indecision.
How to Identify the Doji Evening Star Pattern in Trading?
So far, you know what the Doji Evening Star is all about. But how can you identify the pattern on a price chart? You have to remember a few details.
First, you must know that the pattern appears during an uptrend only. Then, as mentioned, the Doji evening star is made of three candlesticks.
Now, let’s see how the Doji evening star looks on a price chart.

In the GBP/USD chart above, you can see how the price dropped drastically after the appearance of the Doji Evening Star. As seen in the chart, the first candle is a long bullish candle, followed by a small Doji evening star candle, and the last candle is a bearish candle, indicating that the market trend is about to change.
In this case, if you notice the Doji evening star candle pattern, you’ll enter a short-sell trade when the last bearish candle is completed.
With that in mind, here are the key steps that’ll come in handy to successfully identify the Doji evening star pattern:
- Look for the pattern during an uptrend.
- The first candle must be a long bullish candle. Then, the second candle is the Doji evening star candle which appears with a small body and long upper wick.
- The last candle, which confirms the trend is about to change, must be bearish.
- Confirm the pattern with another technical analysis tool or enter the trade once the next candle following the third bearish candle is completed.
How to Trade the Doji Evening Star Candlestick Pattern – Trading Strategies
The Doji Evening Star can be a very effective pattern to find trading opportunities if you learn to identify it correctly; however, like many other candlestick patterns, you also must learn how to trade it. This means you must know where and when to place your entry and exit level.
Furthermore, you better confirm the trend reversal by combining several indicators with the Doji Evening Star. Those include the RSI, MACD, and volume indicators.
So, let’s see the top three trading strategies to use when identifying the Doji evening star pattern.
1. Doji Evening Star with the Relative Strength Index (RSI)
The Relative Strength Index (RSI) is a popular indicator as it helps traders realize whether the current trend could reverse. Technically, the RSI tells you several things; overbought/oversold levels and divergences. Having these confluences from using the RSI indicator allows you to enter a trade more confidently.
When analyzing the Doji evening star, you’ll focus on the overbought condition only as the pattern appears at the end of an uptrend. If the RSI is near the overbought zone (between 70 and 80), the trend is about to reverse. So, with the appearance of the Doji Evening Star, you can confidently enter the trade if the RSI provides another signal that the trend is about to change.
Let’s see an example. The chart below shows that the RSI is in the overbought zone, so we have our confirmation. In this case, you can enter the trade at the third candle of the Doji Evening Star, or you can wait for the next candle to be completed and then enter the trade.
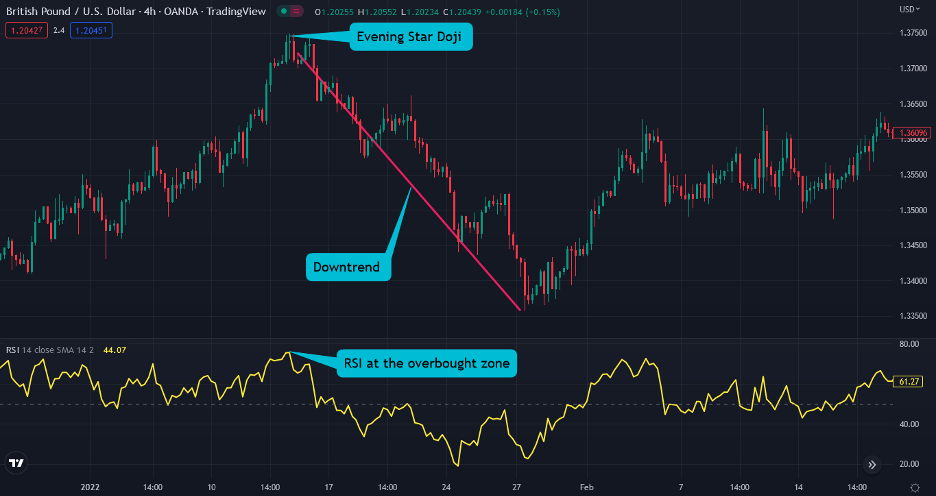
For stop-loss, you can place an order at the recent swing high or the highest level of the first bullish candle. And, for take-profit, you can place an order at the recent low level. Alternatively, you can ride the trend until the RSI reaches the oversold level (near or at 30) and exit the trade.
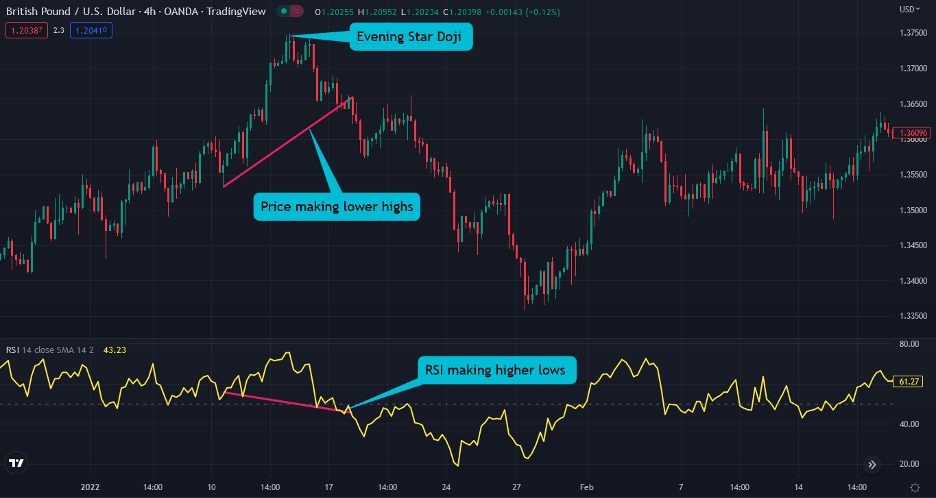
If you aren’t certain about taking the trade too quickly, you can look at the RSI divergence, which is another excellent way to find trades in the market. As you can see below, the price is making lower highs while the RSI is making higher lows, signaling a trend change.
2. Doji Evening Star with MACD
MACD (Moving Average Convergence Divergence) is another popular indicator to combine with the Doji Evening Star pattern. Essentially, the indicator creates a histogram bar, which helps traders predict the trend’s future direction.
When using the MACD as an extra confirmation tool, you’ll look for the MACD histogram bars to fall below the zero line or for a crossover between the two MACD moving averages. Then, you can safely enter a trade when the Doji evening star forms and you notice a bearish signal from the MACD indicator. Moreover, you can place stop-loss at the recent price swing’s highest level with take-profit at the previous price swing’s lowest level.
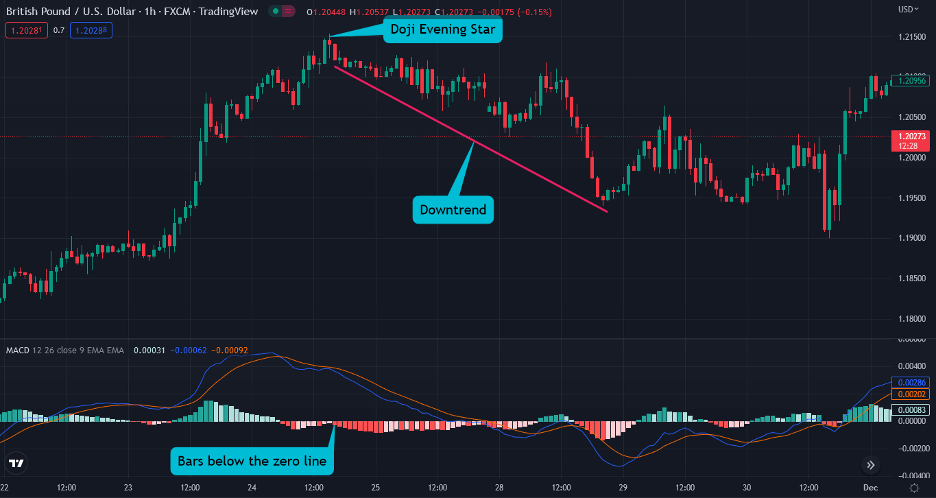
As you can see in the GBP/USD chart above, when the Doji evening star appears, the MACD histogram bars dip below the zero line. In this case, a trend reversal signal is given.
Another way to trade Doji Evening Star with MACD is to wait for the signal lines to move below the zero line. It is a more conservative and safe approach for forex traders who do not want to enter the trade too quickly.
3. Doji Evening Star with a Volume Indicator
A volume indicator is a handy trading tool to monitor high activity in the market. This way, you will be able to notice when big players place large order blocks, which ultimately affects price movement.
So, you can also combine the Doji Evening Star with a volume indicator to confirm the trend reversal. When the pattern appears, the volume in the market should be high or above the average, so you know there is selling pressure, and the uptrend may be over soon.
In the example below, you can see how the trading volume slightly rises above the average, suggesting that the trend is about to change.

The Doji Evening Star Candlestick Chart Pattern – Pros and Cons
Let’s take a quick look at the pros and cons of trading with the Doji evening star candlestick pattern.
Pros
- The pattern appears regularly on price charts
- You can easily identify the Doji evening star pattern
- Doji Evening Star is an accurate trend reversal chart pattern
- You can trade the pattern with a tight stop-loss, which makes it a pattern with a good risk-reward
Cons
- Because stop loss is tight, the order could be triggered too often
- You must combine the Doji evening star pattern with other indicators for further confirmation
Key Takeaways
Below you can find the top key takeaways for the Doji evening star candlestick pattern.
- The Doji Evening Star is a three-candle pattern that appears in an uptrend and indicates the price is about to reverse
- The pattern consists of three candles; the first candle is bullish, the second candle is the Doji evening star, and the third is bearish
- Once the emergence of the Doji Evening Star is complete, you can enter the trade at the third candle or wait for the next candle following the third candle to get completed for more confirmation
- As an extra tool to confirm the pattern, you better combine the pattern with technical analysis indicators like the RSI/MACD and a volume indicator
Frequently Asked Questions about the Evening Star Doji
Here are some of the most frequently asked questions about the evening star Doji candle in trading:
Is Doji Evening Star candlestick bullish or bearish?
The Doji Evening Star is a bearish reversal pattern that appears in an uptrend and signifies a trend reversal.
What is the difference between a Doji evening star and the evening star candle pattern?
Like the Doji evening star, the traditional Evening star has a three-candle formation, appearing in an uptrend. However, the difference is in the shape of the second candle.
In the evening star pattern, the middle candle is not a Doji candle, meaning the opening and closing are not exactly the same. In contrast, in the Doji Evening Star pattern, the second candle is a Doji candle with the same or almost the same opening and closing prices.
What does the Doji evening star indicate?
The Doji Evening Star indicates a bearish trend reversal. It suggests that buyers are losing momentum, and sellers will take control.
Risk Disclosure: The information provided in this article is not intended to give financial advice, recommend investments, guarantee profits, or shield you from losses. Our content is only for informational purposes and to help you understand the risks and complexity of these markets by providing objective analysis. Before trading, carefully consider your experience, financial goals, and risk tolerance. Trading involves significant potential for financial loss and isn't suitable for everyone.


